Keeping Your Margin

Just south of the equator in the mountains of Papua, Indonesia on the island of New Guinea, pilots spend their days carrying food, building supplies, doctors, pigs, and passengers into some of the most remote and extreme airstrips on the planet. That’s where I fly.

Each morning I load my Cessna Grand Caravan with 2,600 lbs of (insert strange cargo here) and depart my home base of Wamena just after the sun sends its first rays of light across the waking skies above. I spend my day winding through narrow valleys and crossing high altitude mountain passes with building clouds and poor communication, only to land on short, narrow airstrips with steep slopes and little room for error. Most of these one-way in, one-way out runways require me to commit to landing well before touchdown due to terrain that is too close to allow for a safe go-around. Everything better be right when I cross that decision point or I could be in for some excitement.

DCIM100GOPRO

The need to keep wide margins of safety might seem obvious in environments like mine, but that doesn’t make them any less important where you fly. You may be a new pilot or an old timer, but keeping your margin should always be on the top of your priority list.

Let’s unpack this further. Margin is not just maintaining the regulatory requirements for cloud clearances or minimum altitudes. It’s more than planning for an alternate airport or carrying the required fuel reserve. Margin is breathing room. It is that extra maneuvering room, the Plan C, the well thought out options that provide you multiple “outs” in any given situation. Margin is what gets you home when things take a turn for the worse.

Margin comes in all shapes and sizes. For myself it includes maintaining double my required turn radius in narrow valleys or choosing not to land when my groundspeed is just 1 knot too high at a short and slippery airstrip. For you, it could be determining a ceiling or visibility minimum requirement that is more conservative than the legal ones or setting a wind limitation that you know is reasonable. When it comes down to it, keeping your margin means you don’t push to the ragged edge of your skill or the aircraft’s capability.

Margin can also refer to your mental or emotional capacity. Are you mentally prepared to divert and miss that important event because the weather is getting bad? Are you ready to handle the disappointment of passengers when you arrive over your airstrip and choose not to land due to approaching rain or a factor that is difficult for a non-pilot to understand? Are you willing to cancel a flight on an important client because you are coming down with a cold or didn’t get adequate sleep? As the PIC of your flying machine, you alone are responsible for the safety of the aircraft and the people on board and those are the tough calls that only you can make.

Fatigue, overconfidence, and complacency are the biggest obstacles to keeping your margin. They are all very subtle dangers and you may be experiencing them without even recognizing it. Fatigue can slow down your thought process leaving you behind the plane and backed into a corner before you know it. Overconfidence might cause you to push weather or commit to a course of action that has no favorable alternatives. Complacency will lead you to believe that, because you have 2000 hours in a particular make and model, you don’t need to do a thorough preflight or complete the pre-landing checklist.

Regardless of experience level, operating environment, fancy avionics, and level of proficiency, margin is something that we all need plenty of. So as you go about your upcoming flights, be asking yourself what you can do to build in more margin. It just might be what gets you home.

Pete Greenwald is a transplant to Atlanta, Georgia who has fallen in love with all things Southern, including his wife, Ashley.  As a pilot and A&P with Mission Aviation Fellowship, he flies the Cessna Grand Caravan in Papua, Indonesia serving people who live in isolation. In his spare time he is on the hunt for the best burger around.

Similar Posts

  • Flying Through Rain

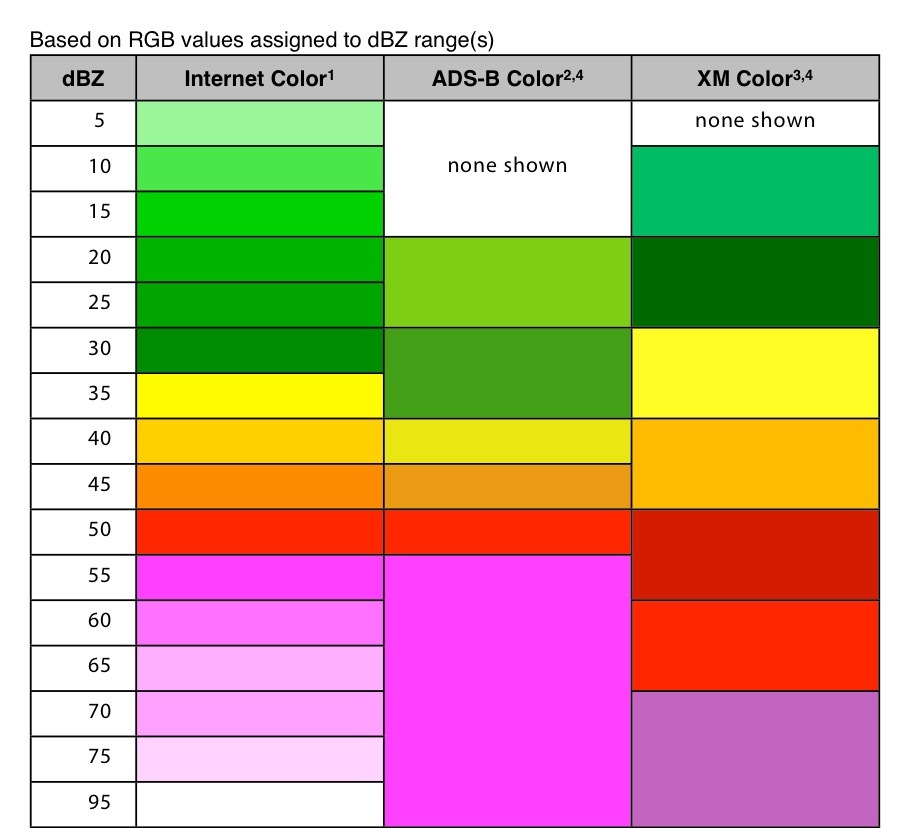
    For the most part, flying through rain is a non-event. If the NexRad or Radar is showing light green or dark green, usually there aren’t that many bumps and your plane just gets a wash. Sometimes the visibility drops down a little bit making us IFR pilots have to transition to our instruments.

    It get’s a little more exciting when the precipitation on your screen turns to yellow. This means there is a lot more precipitation echoes either in the clouds or coming out of the clouds, meaning harder rain. I usually tend to stay away from yellow unless it’s absolutely necessary to go through it.

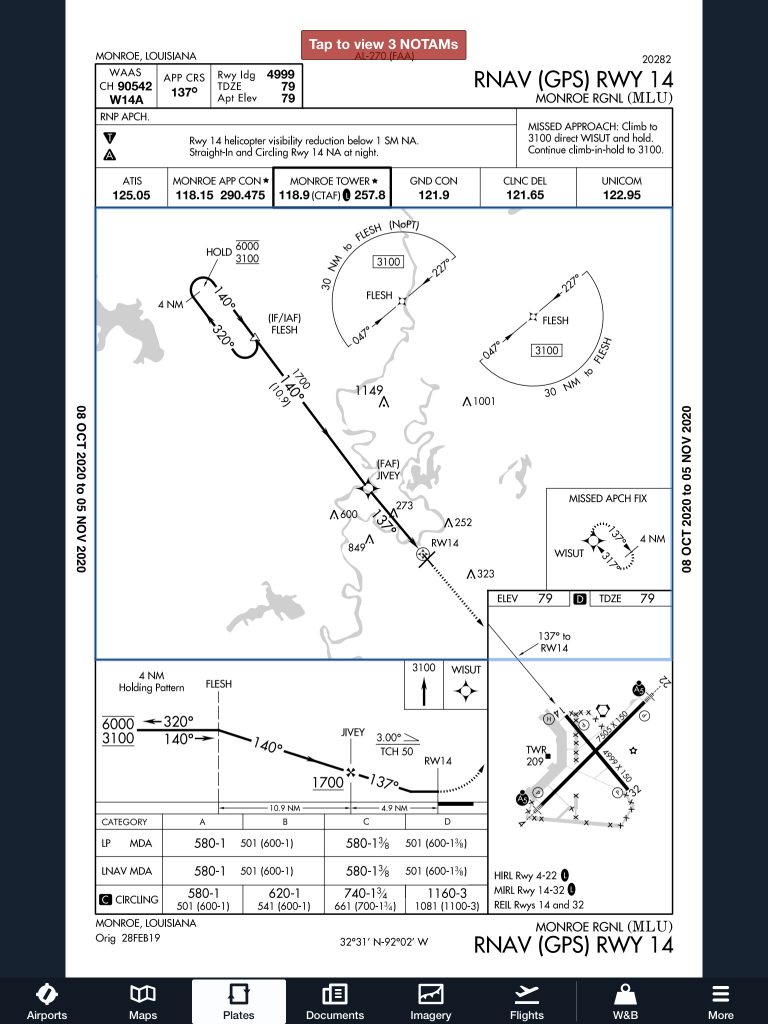
    I had a situation a few weeks ago where I deemed it necessary to fly through some yellow NexRad returns. I was flying a G1000 Columbia into Monroe, Louisiana, KMLU. The winds were mostly light, but slightly favoring runway 04, which was the runway in use. As I got closer, a decent size rain shower with mostly yellow returns was sitting over the final approach fix for runway 04 and slowly tracking to the northeast.

    I didn’t particularly want to spend the entire approach getting beat on with rain, so I decided to fly the RNAV 14 approach at MLU and circle to land on runway 04. The rain hadn’t quite reached the airport yet, so I decided that circling to 04 should be no problem.

    I started the RNAV 14 at the FLESH IAF. Since I was approaching from the west, I did not need to do the procedure turn, so I joined the Final Approach Course (FAC) after crossing FLESH.

    In the meantime, that rain shower was inching closer to the FAC for the RNAV 14. I wasn’t concerned about my safety if I flew through some of it and I didn’t have passengers on board who would get nervous, so I elected to continue. I wasn’t seeing any lightning coming out of the clouds, so it appeared to only be moderate rain.

    Just before I got to JIVEY, the FAF, I entered the clouds and the rain. About 20 seconds later, my altimeter and airspeed started bouncing around a lot. Now, based on all I’ve said so far, what would cause that, and what would you do?

    (Jeopardy theme song playing while contestants ponder questions)

    The answers? Due to the moderate precipitation, water had gotten into my static port and caused the unusual readings on my altimeter and airspeed indicators on the G1000.

    I had experienced this before, so I knew what to do. I reached down and turned the static source from primary to alternate, which starts taking static pressure from inside the cabin in the Columbia. Instantly, everything went normal.

    The other time I had experienced this was also in a Columbia, so I’m under the impression that the way the Columbia static ports are designed, they are a little bit more susceptible to water creeping into them than other airplanes.

    Moral of the story? If your pitot/static instruments start jumping around, the first thing you do is turn your alternate static source on.

    For the most part, flying through rain is a non-event. If the NexRad or Radar is showing light green or dark green, usually there aren’t that many bumps and your plane just gets a wash. Sometimes the visibility drops down a little bit making us IFR pilots have to transition to our instruments. It get’s…

  • Jeppesen vs. Aeroservices Charts

    Many people ask, which set of charts is better? Should I use the FAA Aeroservices charts on Foreflight or pay extra for the Jeppesen charts? Since you have to pay for Jeppesen, they are probably better, right?

    I am not here to say which one is better as a chart preference is just that, a preference for one over the other or for certain features. After a while, muscle memory and routine take over and you probably wont even notice the difference.

    History

    In 1934, Elroy Jeppesen began making his own charts and sold them to other pilots. His little company grew into the giant Boeing chart company we know today. Jeppesen charts are used internationally and therefore include information that might otherwise seem common knowledge, like transition altitudes. The key is, you cannot get FAA Aeroservices charts for international destinations. Jeppesen is the only option for outside the US.

    National Aerospace Charting Office (NACO), or the new(er) name “Aeroservices” or FAA chart, whatever you decide to call them, are United States government issued charts. In addition to civilian use, Aeroservices charts are used by the military so there will be some terminology that does not apply to civilians. The best part about FAA Aeroservices charts are… they’re free!

    If you are in the middle of a transition or trying to decide which charts to use, you have come to the right place. Here are a few key differences.

    Obstacle Departure Procedure Chart
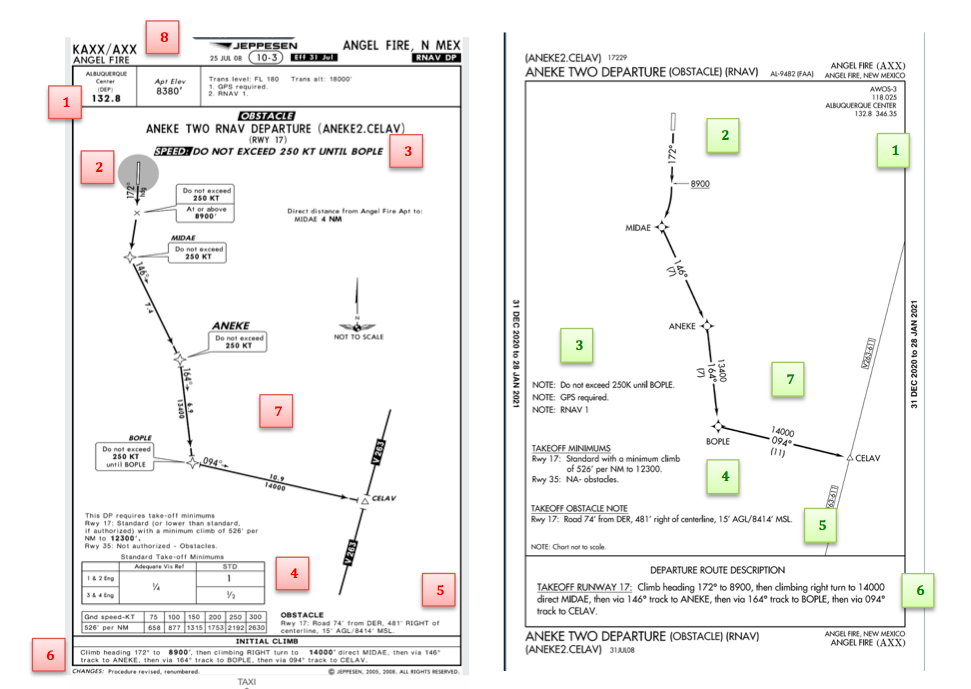
    KAXX (Angel Fire, New Mexico) ODP

    1. Frequencies: FAA Chart provides the AWOS so you have all departure frequencies in once place.
    2. Airport: Jeppesen highlight the airport, which is a nice feature so you can easily see the flow from the airport.
    3. Notes and Remarks: Jeppesen bolds the speed restriction all over the chart so you won’t miss it. All other requirements are in the top right corner. Note the transition altitude 18,000′. Since Jeppesen is used internationally, it is published on the chart since other countries have different transition altitudes. It takes up a chunk of chart real estate, but it’s clear, easy to read, and always in the same place. The FAA charts post all the requirements and restrictions as notes off to the side. Since it’s in the same space as the chart graphic, it’s easy for the eyes to catch while studying the plate.
    4. Take off Minimums: NOT APPLICABLE for PART 91 – however, it’s wise for all pilots to look and abide by them. Jeppesen displays the standard take off minimums table, as well as the rate of climb table, which is nice to have all in one place. The FAA chart gives the non standard information but you need to know/look up the rest in the Digital Terminal Procedures Supplemental document. (Hint: It’s in the Documents section of Foreflight)
    5. Take Off Obstacles: About the same on both charts
    6. Route Description: Similar on both charts, but larger font and clearer description on the FAA chart. When there are different routes from different runways, the FAA chart layout is really helpful.
    7. Graphic Layout: Jeppesen and FAA use the same graphics for all their different charts and plates which makes it easy to read once you are familiar with the respective charts. FAA charts are easy to read and distractions are kept to a minimum. Jeppesen charts make things bold and enlarge pertinent information so you won’t miss it.
    8. Airport altitude: This is only on the Jeppesen chart (the FAA chart doesn’t include it), but it is very helpful for situational awareness. As you brief the arrival altitudes, I think it’s important to have an idea what AGL you are at.

    Approach Charts

    One thing pilots love about Jeppesen approach charts is the clear set up for an approach brief. The top section is created as a “briefing strip” starting with the frequencies, then navigation frequencies, minimums, airport elevation and the missed approach. It’s very natural and user friendly.

    FAA charts have a slightly bigger picture of the approach planview, but the profile view and minimums section can get a bit cluttered. It can feel a little discontinuous when briefing the approach to bounce all over the page. However, some pilots really like the small airport diagram in the corner, which I find really helpful for situational awareness (particularly for students learning circle approaches). Non- standard alternate and takeoff minimums are also clearly noted, but unfortunately we must hunt elsewhere to find them. The Jeppesen alternate minimums and takeoff minimums will both be on the airport diagram

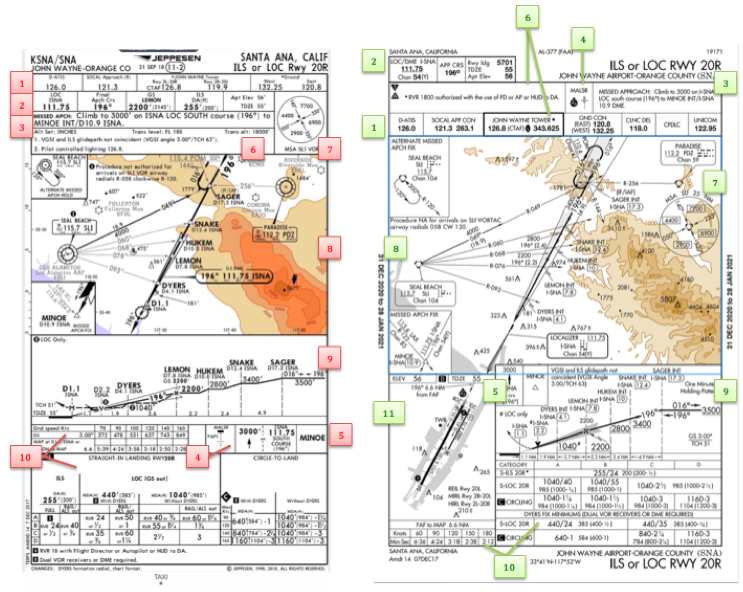
    1. Frequencies: Getting weather and tuning radios is easy on the Jeppesen charts – just follow the briefing strip. The frequency section on the FAA charts is still easy to read, but closer to the center of the page. It’s split up from the nav frequencies and other important briefing information.
      a. FAA charts are created by the government and have military specific information, which are the odd looking frequencies and channels on the chart.
    2. Approach Navigation: On a Jeppesen chart, you will continue to the next line to verify your frequency, course and set minimums (assuming you are straight in on the ILS). On the FAA chart, you will then have to skip to the top of the chart to get the frequency and course, and then scan to the bottom of the page to input your minimums. However, since you could be flying a localizer approach or a circle to land, it’s a good reminder that not everyone using this approach chart will be using the same Decision Altitude (DA). The FAA chart also includes runway distance information so pilots can make determinations of approach speeds and stopping distance if the runway is wet or icy.
    3. Missed Approach – Textual
    4. Approach Lighting
    5. Missed Approach- Graphical: The missed approach information is the same on both charts. The lighting information is key for determining a missed approach and is next to the missed approach text on the FAA chart. It’s found next to the missed approach graphic on the Jeppesen chart. Personally, I find it easier to find and read the lighting information on the Jeppesen chart. Remember, on both charts, the placement of the PAPI on the chart indicates the physical location of the lights (left or right of the runway).
    6. Notes: Both charts have a notes box, but they use them a little differently. Once again, remember that Jeppesen charts are used internationally and include the transition altitudes and altimeter setting info. On both charts, the notes section will be where other critical information will be shared which isn’t really applicable for this airport. On the FAA chart, the tower frequency is starred to note that there are operating hours (you’ll have to check the chart supplement AF/D to find out what those hours are). There is also an L next to the frequency to indicate it is the pilot controlled lighting frequency. You will also find the note about the VGSI and the Approach Glide path next to the profile view on the FAA chart, whereas the Jeppesen chart has that note in the notes section at the top. The FAA chart also has the T and an A in black triangles to note that this airport has non- standard alternate and take off minimums. Again, those are found in separate documents when using FAA charts and on the Airport Diagram when using Jeppesen charts.
    7. Minimum Sector Altitude: Similar on both charts, but in different locations (reminder: ATC vector altitudes may be lower. It is the pilot’s responsibility for safety of flight to maintain safe obstacle clearance, so if you are ever concerned about going below the MSA – just ask ATC).
    8. Planview: Other then differences in size, visuals, and text, the information displayed on both is very similar.
    9. Profile View: Again, the displays look different and pilots will have their preference, but the information is the same.
    10. Minimums: Jeppesen charts not only note the category for each approach with its designated letter, but also displays it in knots. It is recommended that if you increase your approach speed (based on flaps or gusty winds or perhaps a faster speed for a circle to land approach) that you should use the higher category minimums. The reference guide makes that easy to look up. The other benefit of the Jeppesen charts is right the table that contains the time from the final approach fix to the missed approach point for a localizer approach, it also shows the rate of descent with the associated ground speed to maintain a 3 degree glideslope. Now there is no excuse not to set pitch and power! The minimums posted in parenthesis are for the military, but RVR in statute miles is also included.
    11. Airport diagram: Only on the FAA charts, this particular feature is particularly useful for situational awareness. The arrow pointing to the runway shows the direction the approach is arriving from so planning a circle to land is a cinch. There is also a lot of other information that can be gathered from the airport diagram for quick reference or to help a disoriented pilot: lighting, displaced thresholds, closed taxiways, and runway placement and lengths. This is easily one of the best perks of an FAA chart.

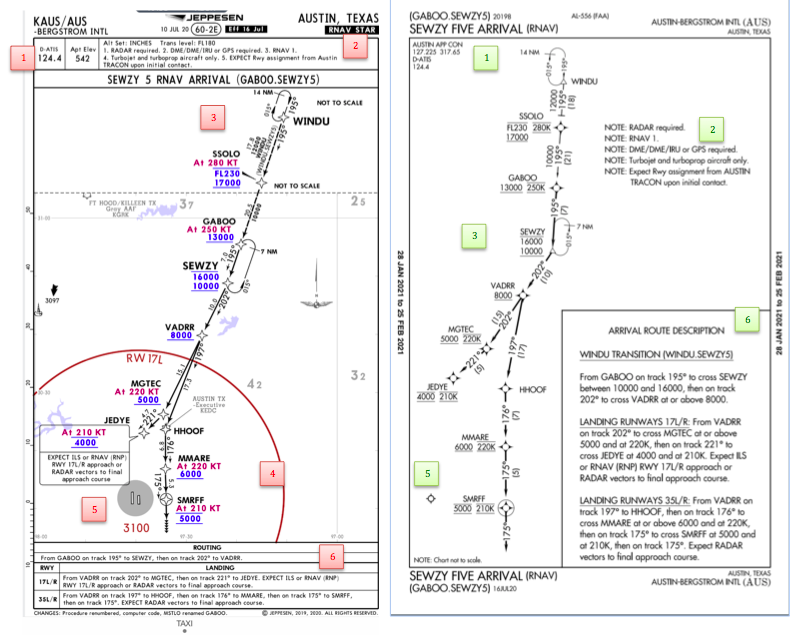
    Arrival/ Departure Charts: Sewzy 5 Arrival KAUS

    The Jeppesen lay out is very attractive and draws the pilots eye in a clear way to all the important information. The colors pop out, so the required altitudes and speeds are easy to read and remember. The chart, which is the proper scale, shows MORAs , easy to find airports (and runway layouts) and is over all easy to follow. However, the texts, while very clearly laid out, are small and difficult to read and pushed to the very edges of the chart. FAA charts are simple and fairly easy to read, but the airports are not as obvious and the flow to the airport requires a good look. The table on the Jeppesen chart is a really nice format, but the text and Notes for arrivals on the FAA chart are easy to find and much easier to read quickly.

    1. Frequency: FAA charts include the approach frequency on the arrival, which is helpful for having radios tuned. During a busy time when the controller changes your frequency, all you have to do is verify the frequency you already set, rather then totally stop what you’re doing to switch it. The Jeppesen charts add the airport elevation next to the ATIS, which really aids situational awareness.
    2. Notes: Jeppesen notes are clearly numbered and tucked away nicely in a box, but the FAA chart notes pop out in the middle of the page and are easy to skim for pertinent information.
    3. Planview: I think Jeppesen is the clear winner here- it is so easy to read, it only takes one glance to know where the primary airport is and how the arrival flows. The chart being at the proper scale offers the pilot important geographical information and over all is a clean look. Notice the small series of arrows after SMRFF on the the Jeppesen chart; those indicate the pilot should expect radar vectors. The FAA charts include those instructions in the text, but I find the visual reference on the chart helpful. The FAA charts are equally clean, with altitude and speed restrictions easy to read even if they don’t jump out. When there are multiple airports that the arrival serves, the airports are clearly marked, though, I think it would be nice to have a little more information surrounding the primary airport for better situational awareness.
    4. MSA: only on the Jeppesen chart
    5. Primary airport: The runway alignment and grey highlight on the Jeppesen chart stands out very clearly, while the FAA airports are a little more obscure.
    6. Arrival route description: The table on the Jeppesen chart is easy to follow but the text is very small and pushed to the bottom. The route description is much easier to find and read on the FAA chart.

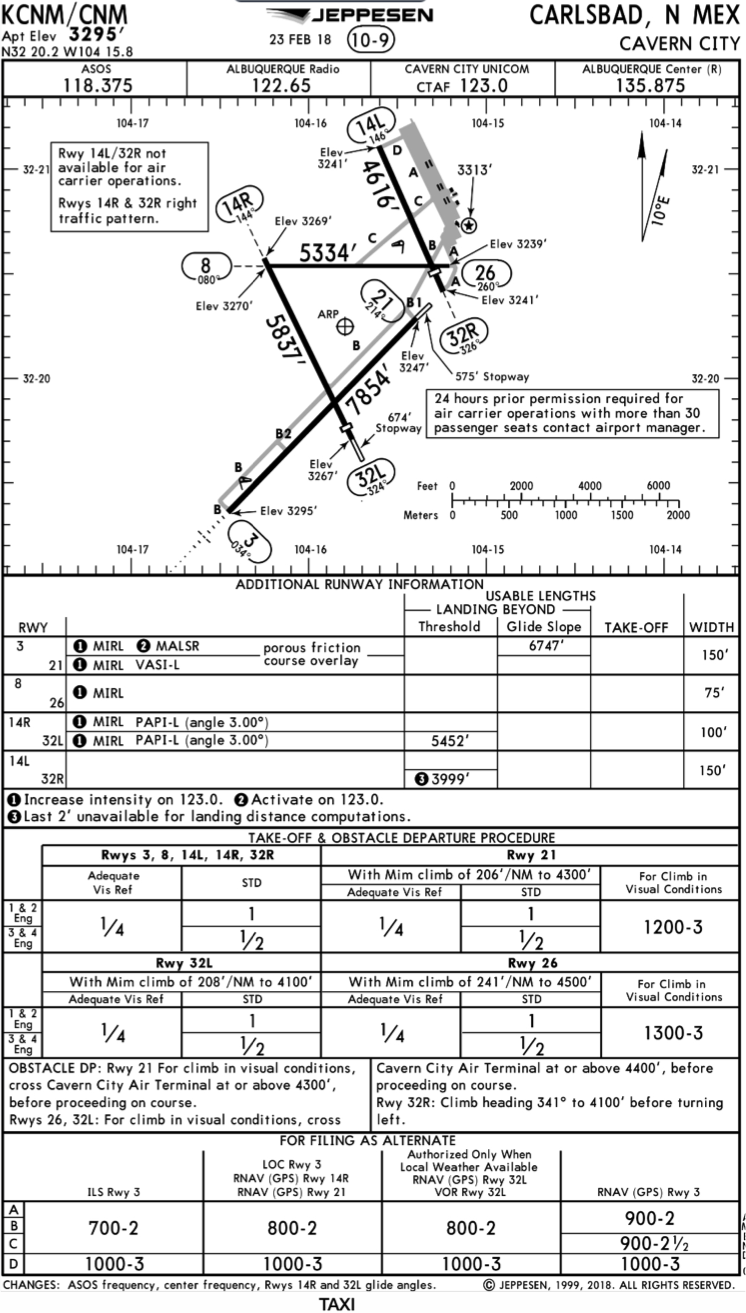
    Airport Diagram

    The Jeppesen Airport Diagram page has it all: frequencies, airport diagram, runway info, take-off minimums, departure procedures and alternate minimums. It’s a one-stop shop. It makes preflight planning easy when its all at your fingertips.

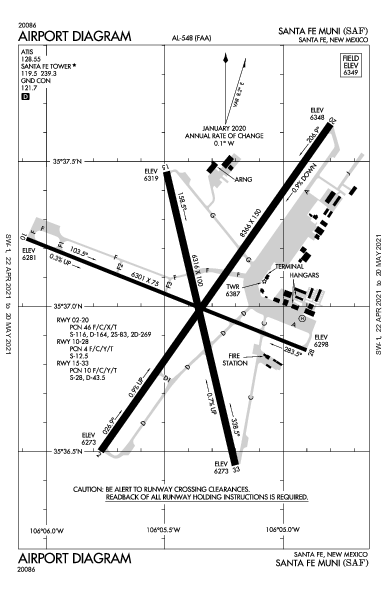
    The FAA charts usually require a little more searching for different pieces of airport information. The Airport Diagram itself is just the airport layout. Above, you will see a simple FAA Airport diagram. It’s clean and simple, perfect for a knee board print out.

    In the flight planning process, as you look at what approaches you will be using for the airport, you might see an A or T inside a triangle. Those indicate that you will need to look in the Alternate Minimum or Take off minimum documents for more information. The Takeoff Minimums document (see below) is also where you will find any obstacle departure procedures for that airport. Apps like Foreflight help you out by posting the take off minimums under the departure tab. Even though it’s a little more difficult to read, I didn’t crop out the airport information so you can see what it looks like in context.

    FAA Alternate Minimums on the Left and Takeoff Minimums and Obstacle Departure Procedures on the Right

    Many people ask, which set of charts is better? Should I use the FAA Aeroservices charts on Foreflight or pay extra for the Jeppesen charts? Since you have to pay for Jeppesen, they are probably better, right? I am not here to say which one is better as a chart preference is just that, a…

  • A Proper Cross Country Flight Checklist (Part 1)

    I love cross country flights. Airplanes are designed to travel.  When I was instructing private students, my favorite lessons were always the first cross country flights. I looked forward to getting my students out of the pattern, away from the practice area, and showing them what they could really look forward to as a private pilot.

    When I was in college, my friend and I borrowed his dad’s Cessna 150, did a cross country flight in it from Indianapolis to Kitty Hawk, then down the coast to Florida. We camped in the grass next to the airplane wherever the airport managers would let us and had our own aviation adventure complete with mechanical problems, unexpected weather, and interesting people along the way. These types of trips have produced some of the best memories and experiences that I’ve acquired during my aviation career so far.

    Unfortunately, I know many people whose only cross country flight experience is what was necessary to satisfy their Private and Instrument training requirements. Some of them are nervous about the idea of venturing away from the familiarity of their home airport, while others are relatively new pilots who simply don’t know where to start planning a long cross country flight.

    I’ve taken some notes on my preparations for an upcoming cross country flight that I’ll be flying in my dad’s Bonanza. I’m hoping this checklist might help others feel a little more confident that they have everything they need to get going.

    Oil

    Its always a good idea to bring a few extra quarts of oil. If you stop somewhere and find you need some, its nice to have the right kind on hand. Never assume that the airport you’ll be landing at next will have oil available.

    I like to keep a few extra quarts of 15W50 in the back of the Bonanza, just in case (photo from oil-store.com)
    I like to keep a few extra quarts of 15W50 in the back of the Bonanza, just in case (photo from oil-store.com)

    Fuel Stops

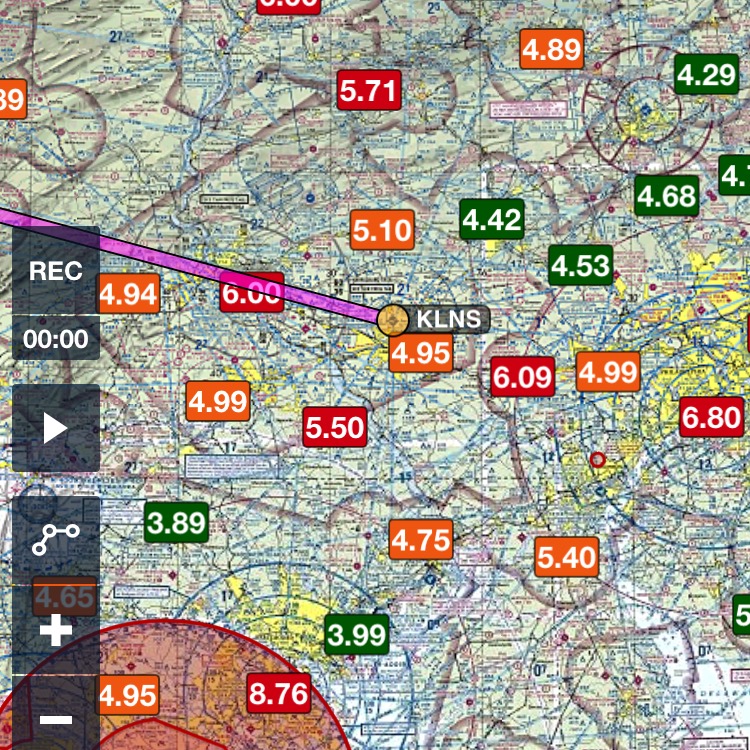
    Here is an example of the 100LL price tool as seen on the Foreflight maps page
    Here is an example of the 100LL price tool as seen on the Foreflight maps page

    I’ve learned the hard way that calling ahead to verify fuel availability can be extremely important. I landed at an airport in Ohio one beautiful Sunday morning to find that the FBO wouldn’t be open until much later in the day. Naturally, there was no other fuel available on the field. I hadn’t called ahead to verify the hours of fuel availability (I assumed they had Self Serve) and had only 2 options: wait a while for the FBO to open, or try and find somewhere else nearby that had gas. As far as price, www.100LL.com is a valuable tool for finding cheap fuel. Foreflight also has posted prices for 100LL and Jet A, but it’s still a good idea to call ahead and verify price and availability.

    Batteries for electronics

    It’s miserable to run out of batteries for a noise canceling headset with hours remaining in your flight. Bring spares, not only for your headset, but for your flashlight and other gadgets as well. Make sure your hand held GPS, iPad, and Stratus are charged (if you have them). I like to carry a charge cable and adapter as a backup so that I can plug things into the cigarette lighter.

    Jumper Cables

    We always carry the ground power cable in the back of the Bonanza just in case we ever need a jump. Last month, when I was flying down to Texas, I was glad I had them; we had a dead battery after our fuel stop and had to borrow some power from an FBO worker’s pick up truck. Don’t assume that wherever you are stopping will have the correct cable to jump your airplane, especially if it requires a specific plug.

    These are the cables we keep in the back of the Bonanza (photo from airchief.com)
    These are the cables we keep in the back of the Bonanza (photo from airchief.com)

    Parking Fees

    Every airport is different. I like to call ahead and find out how much the FBO is going to make me pay in landing/overnight fees. When I flew up to Buffalo last summer, I paid 25 dollars for parking at Niagara International (IAG). Had I parked at Buffalo (BUF), they would have charged me over $200.

    Approach plates and charts

    Make sure you have current approach plates and charts either physically available or downloaded before you blast off. Having a copy of an AFD is a good idea as well, be it digital or paper.

    Rental cars

    If you arrange it beforehand, many FBO’s will have the car ready for you upon arrival. You may also be able to drop the car off at the FBO when are finished, instead of taking it back to the rental agency. It sure is nice to have the car pulled up next to the airplane when it’s time to unload.

    Hotels

    Bigger FBO’s may have discounted rates with local hotels. If you call the desk and explain your needs they may offer to book it for you, or at least point you in the right direction. It may be worth picking an airport with more expensive fuel if it puts you closer to the hotels or restaurants you want to go to.

    Come back next month for Part 2!

    Andrew Robinson is a 135 Charter Pilot and flight instructor who lives with his wife and 2 daughters in Pennsylvania.  He flies Pilatus PC-12s and instructs in Beechcraft Bonanzas.

    I love cross country flights. Airplanes are designed to travel.  When I was instructing private students, my favorite lessons were always the first cross country flights. I looked forward to getting my students out of the pattern, away from the practice area, and showing them what they could really look forward to as a private…

  • Breathing…It’s The Difference in Engine Performance

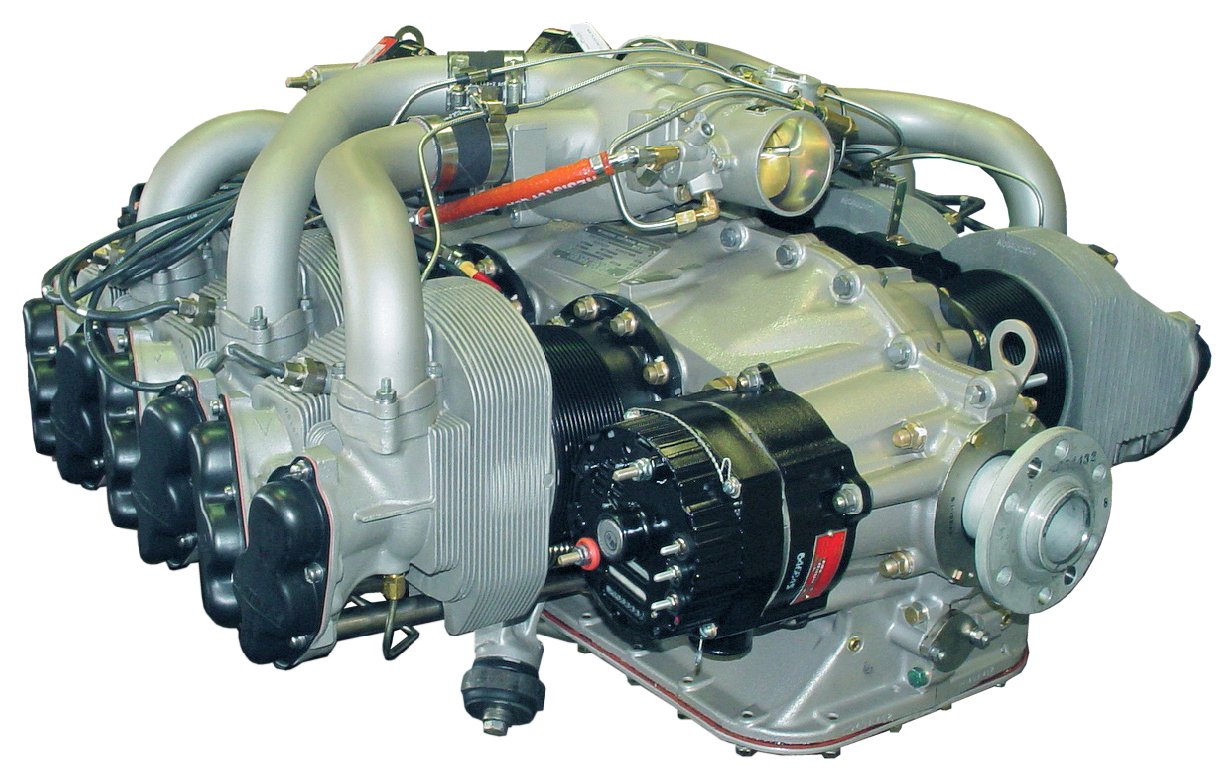
    The PT6 engine that’s found on the Jetprop and Meridian is designated a -21, -34,-35, or a -42A.  The Continental engine on a Malibu is either a TSIO 520 or a 550.  What’s the difference? Why should I care? Most pilots don’t understand the difference, but it’s pretty easy to understand…and it’s all about breathing.

    Whether a piston or a turbine, the engine has a ratio of fuel/air that works best.  For a piston model, we can make adjustments to this ratio by adjusting the mixture.  In climb we use a richer ratio to help cool the engine, and in cruise we lean the mixture to save fuel since we don’t need the extra fuel for cooling (due to higher speeds which cools the engine). In the turbine, the ratio is set and there’s nothing that can be done about it…except climb to a higher altitude.  But, more about that in a second..let’s go back to the piston discussion…

    Piston: A Continental 520 engine and the 550 engine are flown exactly the same.  On takeoff, both will develop 310HP (38″MP with the 520, 35.5″MP with the 550).  So, why would a pilot want a 550 in his airplane as opposed to a 520?  The answer is breathing.

    A 520 is named appropriately because the engine displaces 520 cubic inches of air with each complete cycle of all 6 cylinders.  To determine the displacement, just figure the bore (diameter of the cylinder) and the Stroke (how far the piston travels in the cylinder) and plug the numbers into this formula:

    CID = Bore X Bore X 0.8754 X Stroke X # of Cyl.

    Here’s the bore and stroke of the Continental 520 and 550 engine:

    TSIO 520:  Bore = 5.25″ and Stroke = 4″
    TSIO 550: Bore = 5.25″ and Stroke = 4.25″

    So, you can see the two engines are exactly the same except the 550 has a little longer stroke, and therefore displaces a little more air.  Said another way…it the sucks the air into the engine a little better.

    So, with this knowledge, the ability for the engine to breathe becomes a little more clear.  Both a 520 and a 550 will perform exactly the same until the point that a 520 simply cannot suck enough air and begins to develop less MP as a result.  For most 520 engines, this will happen somewhere around 18,000 ft.  But, it is dependent upon a myriad of factors including: health of the engine, altitude, temperature, and atmospheric pressure. When the 520 hits this point, the throttle can be full-forward, but the engine will not develop full MP, but some number that is less.  I’ve seen a max MP at FL250 in a 520 Malibu to be about 31″MP.  So, you can probably guess that the rate of climb will correspondingly suffer as the engine develops less MP.  How do we fix this problem?  Enter the 550…
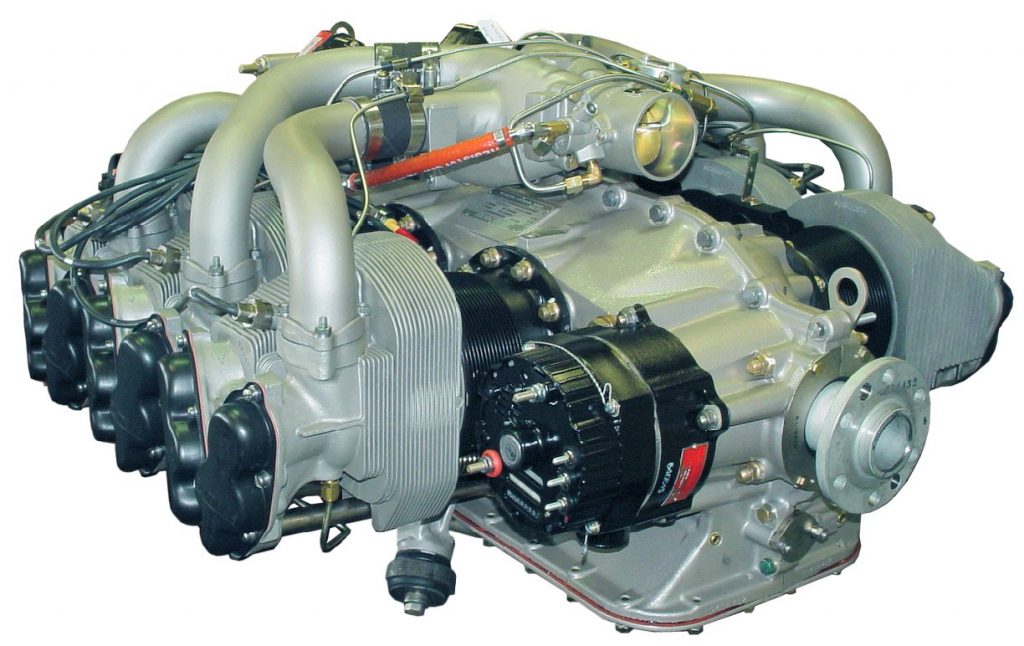
    Since the 550 displaces more air, the engine will maintain max MP to a higher altitude.  When the 520 begins to develop less power at about FL180, the 550 engine will be able to continue to maintain 35″ at a higher altitude.  Make no mistake…the 550 will also hit an altitude where is cannot develop 35″MP, but this altitude will probably be nearly FL220.  So, the 550-powered Malibu will reach cruising altitude faster than the 520.

    But, at cruise both engines are pulled back to 30″MP.  So, either engine will deliver the same cruise speed because they are both able to develop 30″MP at any altitude.  Does it really matter if you’ve got a 520 or a 550 engine?  Answer: not much.  Both are excellent engines and both will deliver the airplane to the destination, but if the chosen altitude is above FL180, the 550-powered airframe will probably arrive a few minutes earlier.  Which would I want if I were purchasing an airplane?  It’s not a big enough deal, IMHO.  I’d select the best airframe/engine/prop combination and not put much weight into the 520 vs. the 550.

    Turbine world: So, how about the -21, -34/35, and -42A compare?  Here, there’s  big difference, but it’s still all about the breathing.  A -21, -34/35, and -42A are all derivatives of the famous PT6 family of engines, and all are designed to be 1000+SHP engines de-rated to fit the airframe.  For instance, the -42A engine is 750SHP when mounted on a King Air 200, but the same engine is derated to 500SHP when mounted on the Meridian.  Ditto with the -21 and -34/35 engines…all are de-rated.  So what’s the difference? Breathing…

    At the lower altitudes all will develop their maximum rated SHP, meaning they will all develop maximum torque.  And, down low there’s plenty of air to breathe so the engine has no problem developing that torque at a low ITT.  But, as altitude is gained, the engine must suck more air to develop the same torque, and the ITT goes up.  At some point in the climb (depending upon altitude, temperature, pressure, and IAS) the engine will not be able to produce max torque without exceeding Max ITT.  At this point, the engine cannot breathe any more (suck in anymore air), and the power (torque) developed falls off.  With the -21 engine, the power falls off quite dramatically because the engine simply cannot breathe well.  It is a smaller engine and more air cannot be forced into the compressor section.  For the rest of the climb the engine is “ITT limited” and the performance will suffer.

    The -34/35 engine is a little bigger and will develop maximum power (torque) to a higher altitude.  And, when the torque does drop off (as altitude is increased), the rate of decrease is less because it can breathe easier due to it’s larger size.  Guess what? The -42A will beat out the others and develop max torque to an even higher altitude.  With this decrease  in torque available also comes a welcome friend…less fuel burn.  Altitude is the friend of any turbine pilot, and he/she will climb to the highest altitude possible to save on fuel.

    The end result is the -21 powered Jetprop will cruise at 238 KTAS (in the summer) with a fuel burn of only 28gph.  The -34 will have higher torque than the -21 and will develop more SHP and will have a higher cruise (260 KTAS in the summer) with a correspondingly higher fuel burn (32gph).  The -42A will be breathing easily at higher altitudes, and will develop the most torque, but with a fuel flow of 39gph.  The Meridian (with the -42A) will not out-perform the -34/35 Jetprop in cruise purely because the Meridian is much heavier.

    Just remember…fuel flow in a turbine is always commensurate with its ability to breathe and a turbine’s ability to breathe is a function of the engine’s ability to breathe.

    With this knowledge…let’s check your understanding.  Answer this question: Will a Jetprop cruise faster in the summer or winter?  Remember, cold air is more dense than warm air, and an engine will develop power according to it’s ability to suck in air.  More air available, more power available.  Answer: Winter.

    A good analogy: I’m a Cross-fitter (meaning I do crossfit workouts a lot).  In the gym we have various workouts that test a person’s ability to perform.  Guess who usually does the best?  Right…the guy who can breathe the best.  A person is nothing more than an engine…we intake air and combine it fuel and burn it to develop energy.  In Crossfit, the person with the biggest engine (muscles that can develop power) that can sustain power (good aerobic capability) will win almost every time.  The only variables then are genetics (how well-made is the engine), flexibility (you’ve got to be able to get into the position), and skills (there are more efficient movements).  A good Crossfitter will work hard on mobility, skill, and try to increase the bodies ability to increase capacity through a tough workout.

    To get maximum performance, the pilot cannot change the engines skill or mobility (at  least not without an engine change!), but a thorough understanding of the how the engine breathes will help him/her use the power that is available to the fullest.

    Joe Casey’s aviation story began in 1990 with his first flight near Nacogdoches, TX in a Cessna 172. From lift-off, Joe knew he would have a lifetime passion flying just about anything that will leave the ground…He was completely hooked.

    Along with being an FAA Designated Pilot Examiner (DPE), Joe is an ATP/CFI-AHMG and Commercial Rotorcraft/Glider Pilot in the civilian world and also a UH-60/AH-64 Pilot-in-Command/Instructor/Examiner Pilot in the US Army Reserves.  His passion for the last 19 years, however, has been the PA-46 Malibu/Mirage/Matrix/Jetprop/Meridian. Has has amassed over 6,500 hours in various PA-46 airframes and believe it to be one of the finest flying machines available for the serious cross-country pilot with an eye for efficiency.

    Now, Joe has flown more than 12,200 hours in just about every imaginable environment. Whether providing initial/recurrent training in the PA-46’s, TBM’s, instructing in NVG’s in a UH-60 Blackhawk, flying the King Air series of airplanes, giving tailwheel endorsements, or taking kids flying for the first time, he simply loves flying machines and the people who fly them.

    The PT6 engine that’s found on the Jetprop and Meridian is designated a -21, -34,-35, or a -42A.  The Continental engine on a Malibu is either a TSIO 520 or a 550.  What’s the difference? Why should I care? Most pilots don’t understand the difference, but it’s pretty easy to understand…and it’s all about breathing….

  • TBM Debuts the 960 at Sun N Fun

    This is a Press Release from Daher’s website, the maker of the TBM 960.

    Sun ‘n Fun Aerospace Expo, Lakeland, Florida, April 5, 2022 – Daher today unveiled the latest high-end version of its TBM pressurized single turboprop aircraft family – the TBM 960 – which incorporates Pratt & Whitney Canada’s advanced PT6E-66XT engine and a fully digital e-throttle, along with a digitally-controlled cabin that incorporates an all-new environmental control system, LED ambience lighting and electrically-dimmable windows.

    The TBM 960 was introduced at the Sun ‘n Fun Aerospace Expo in Lakeland, Florida, where Daher is exhibiting the first production airplane (exhibit stand #MD-22B).

    “The TBM 960 is the quintessential TBM, representing the fifth evolution of our very fast turboprop aircraft family since the TBM 900-series’ introduction in 2014,” commented Nicolas Chabbert, the Senior Vice President of Daher’s Aircraft Division. “It takes the maximum advantage of today’s turboprop technology to provide digital control of the engine and the propeller.”

    The TBM 960 retains the rapid speed of Daher’s TBM family while enabling lower fuel consumption. At Daher’s recommended cruise setting of 308 kts., the fuel consumption is only 57 U.S. gallons per hour, which is a 10% fuel economy compared to maximum cruise setting for more sustainability.

    At the heart of this latest TBM version is the intelligent PT6E-66XT powerplant and Hartzell Propeller’s five-blade RaptorTM composite propeller, both of which are linked to the dual-channel digital Engine and Propeller Electronic Control System (EPECS).

    With the EPECS, the PT6E-66XT’s startup is fully automated after a single-switch activation. The cockpit’s power lever is an e-throttle, using a single forward position from takeoff to landing – with the EPECS optimizing powerplant performance throughout the flight envelope while

    Daher unveils the TBM 960 at Sun ‘n Fun Aerospace Expo

    reducing pilot workload by integrating all functions and protecting the engine’s life. Analysis of engine parameters is driven by 100-plus smart data inputs.

    The RaptorTM propeller is fully integrated into the propulsion system. It is specifically designed to reduce overall weight and improve the TBM 960’s takeoff distance, climb and cruise speed. Turning at 1,925 rpm during maximum power output, the Raptor contributes to limiting noise and vibration. Its sound level during takeoff is just 76.4 decibels, meeting the most stringent international noise standards.

    With its G3000® integrated flight deck, the TBM 960 retains Daher’s e-copilot® concentration of technological innovation and safety systems in the TBM, which can be compared to an “electronic copilot.” This includes an icing protection system, flight envelope monitoring through the Electronic Stability and Protection (ESP) and the Under-speed Protection (USP) systems, the Emergency Descent Mode (EDM) function, as well as the game-changing HomeSafeTM emergency autoland system.

    New to the TBM 960 is the Garmin GWXTM 8000 doppler weather radar with advanced surveillance features such as lightning and hail prediction, turbulence detection, zero blind range for close-in returns, and ground clutter suppression. The TBM 960 also is the first application of Garmin’s GDL® 60 next-generation data transmitter for automatic database upload and interconnection with mobile devices.

    The TBM 960’s Prestige cabin extends Daher’s use of digital power inside the aircraft, featuring an all-new environmental control system, LED ambience strip lighting integrated into both sides of the overhead ceiling panel, and electronically-dimmable windows – all controlled by a PassengerComfortDisplay(PCD). Enhancementsinthecabin’sstyleandcomfortalsoinclude new ergonomically enhanced seats, USB-A and USB-C power plugs, individual cupholders and headset hangers for each occupant.

    For the TBM 960, a fifth TBM paint scheme – called Sirocco, based on the creativity of French designer Alexandre Echasseriau – has been added to the aircraft’s style customization possibilities.

    The TBM 960 has been certified by EASA (the European Union Aviation Safety Agency); with certification by the U.S. FAA (Federal Aviation Administration) currently underway. Deliveries will begin in the first half of 2022.

    With the new aircraft’s launch, Daher’s TBM family is now offered in two versions: the TBM 960 and TBM 910.

    About Daher – www.daher.com

    This is a Press Release from Daher’s website, the maker of the TBM 960. Sun ‘n Fun Aerospace Expo, Lakeland, Florida, April 5, 2022 – Daher today unveiled the latest high-end version of its TBM pressurized single turboprop aircraft family – the TBM 960 – which incorporates Pratt & Whitney Canada’s advanced PT6E-66XT engine and a…

  • An Educational Runup

    When a pilot thinks of an engine runup in a single engine piston airplane, typically it is let’s find out if the engine is running rough or not, meaning a spark plug is fouled.  Believe it or not, there is a little more to learn from a runup than just checking the spark plugs.

    A distinct advantage to having an engine monitor that monitors all EGTs and CHTs is you get a better idea of engine health.  When switching to one magneto or the other during the runup, all the EGTs should rise, showing that the temperature of the exhaust gas is going up from each cylinder.  This occurs because when running on only one magneto and one set of spark plugs in each cylinder, the mixture takes longer to burn, so, when the exhaust valve in the cylinder opens, the burn is still on going and this hits the EGT probe, causing a temperature rise.  An indication of a magneto failure in flight would be a rise in all the cylinders EGT without a change in mixture setting.

    Now that we know what to look for when checking each magneto, what would one look for to show that there is a problem?  The basic that each student pilot is taught still applies.  The engine manufacturer puts a limit on RPM drop during the runup.  When checking one magneto or the other, watch for an excessive RPM drop.  If the RPM drops past the limit, this usually will be accompanied by engine roughness.

    Why is that?  Let’s look at the cause for the excessive RPM drop.  For this, we need to go back to our EGT indicators.  Let’s say we have a 6 cylinder engine.  When the key is turned to the right magneto, the RPM drops 250 RPM and the engine gets very rough.  Look at the EGT gauge.  The cylinders where the spark plugs are firing normally will all show a temperature.  The cylinder (or cylinders) where there is no combustion, meaning a bad plug, will show no temperature.  This is because the mixture is just sitting in the cylinder and not igniting, therefore, no exhaust gases will be pushed out so there will be no EGT indication for that cylinder.  This is also how you tell a mechanic which cylinder to check for the bad plug.

    It could also be a bad magneto.  If multiple cylinders EGT all drop, or the engine wants to quit entirely, you have a bad magneto or bad ignition harness.

    What else can you learn during the runup?  Electrical system health is key, especially in all electric airplanes (meaning no vacuum system).  It’s a very good idea to turn on all the lights and pitot heat to ensure that a rise is indicated on the ammeter.  This means the alternator is carrying the load and working properly.

    The next time you do your runup, keep an eye on your EGT to see the rise during a magneto check.

    When a pilot thinks of an engine runup in a single engine piston airplane, typically it is let’s find out if the engine is running rough or not, meaning a spark plug is fouled.  Believe it or not, there is a little more to learn from a runup than just checking the spark plugs. A…

One Comment

  1. Pingback: Contact Approaches

Leave a Reply

Your email address will not be published. Required fields are marked *