IM SAFE: Are You Really?

As pilots, we are all familiar with the IM SAFE acronym that the FAA puts out.  It comes up as part of the ground training over Human Factors during private pilot ground school.  We all memorize it, spit it out for our check rides, then most of us promptly forget about it.

When I was training for my pilot’s licenses, I was at a Part 141 school that was very standardized (LeTourneau University, who has a fabulous aviation school).  Before each flight, we had to do a self evaluation based on the weather and the IM SAFE checklist.  Based on our answers, we would then determine if the conditions were conducive to flying as well as if I was physically okay to fly.

This was a great tool because not only do pilots have to pre-flight the airplane, they also need to pre-flight themselves.  It’s very easy to fall into one of the “Hazardous Attitudes” if there is a pressing meeting or you haven’t flown in a while and it’s a beautiful day, but maybe you aren’t physically fit to control an airplane.

Let’s break down the IM SAFE checklist to dig a little deeper into the physically fit side of flying.

Illness

This one is pretty easy.  Are you sick?  If so, how sick?  If you can’t hardly talk or your body feels like it was hit by a truck, then flying probably isn’t in your best interest.

The tricky area can become if you are only a little sick.  Maybe you have a cough or a little cold or a headache is starting to form.  You probably could go fly, but is it really a good idea?  It could be something worse, or it may be nothing.  You have to know yourself and put limits on yourself before you wake up on the day of your big meeting two states over.  Set illness personal minimums and stick to them.

Medication

There are a slew of drugs, both prescription and over the counter, that pilots cannot take and fly.  AOPA has a hotline to call for pilots to find out if they can fly with the medication they are taking, or what meds they can take to give them relief and still operate an aircraft.

Another great resource is your medical examiner.  Just give him/her a call and they will be more than happy to let you know what you can and can’t take.  They’ve been educated in the area of aviation so they are very knowledgeable.

Stress
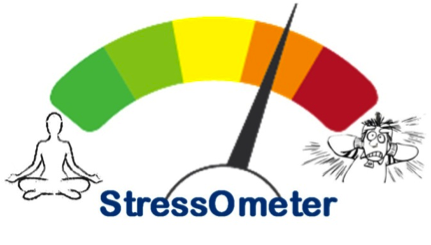
StressometerThis is a huge one that pilots ignore a lot.  Maybe it was a stressful day at work, maybe you are running late to the airport, your meeting got moved up, whatever.  Stress can jump on you and mess up a pilot’s thinking very quickly.  If you have a lot of other things on your mind and you aren’t able to focus just on flying, it might be a good idea to stay on the ground.


Alcohol

Out of the whole IM SAFE list, the alcohol limitations are very clearly defined.  8 hours bottle to throttle, no more than 0.04% BAC, no operating an airplane while under the influence, and no carrying passengers who are visibly intoxicated.  For your personal minimums, it’s a good idea to increase that time to 12, 18 or even 24 hours bottle to throttle.

Fatigue

Learning to fly while a college student led to a fair share of canceled flights due to fatigue.  I operate best on 8 hours of sleep in the past 24 hours.  I can function on 6, but anything less than 6 hours, my performance drastically drops off, sometimes to a point where I wouldn’t be safe.  I discovered this while with my flight instructor attempting to do a holding pattern and completely botching it up.

I observed this as a CFI quite often.  If I was doing ground with a student and they were struggling, my first question would be, how much sleep did you get last night?  More often than not, if I had to ask that question, I would get an average answer of 3 to 4 hours (I even had one guy show up for a flight block on 2 hours sleep.  I sent him back to the dorm).

Fatigue is very easily overlooked because it’s not measurable.  Needing to get a flight lesson done or needing to get somewhere when you are obviously fatigued is not a good idea.  Make sure you get a good night’s sleep before a flight and don’t be afraid to cancel if you didn’t.  Set some sleep personal minimums and make them hard and fast.

Eating

Don’t skip meals and fly.  Performance greatly decreases when a pilot is hungry.  At the very least, stick a couple of food bars in your flight bag to give you some nourishment.

Also, stay hydrated, especially in the summer time.  I carry a huge bottle of water with me on all my flights because I get headaches if I don’t drink enough.  Getting dehydrated on a long flight can lead to all sorts of performance problems (over hydration is also a problem in the air, but that’s what Gatorade bottles are for, right?).

All this to say, have some personal minimums when it comes to you and your body.  Check the plane, check the weather and check yourself.  If anything falls in the “red” area in any one of those three categories, stay on the ground and don’t press your luck.

Similar Posts

  • Garmin Smart Glide

    Recently, I was training a customer who had a brand new instrument panel installed in his TBM 700. The avionics shop that did the work (Abilene Aero, who I highly recommend for any panel installs, located at KABI) told us when we picked the plane up that the new Garmin GTN 750Xi had the most recent software update, which included the Garmin Smart Glide.

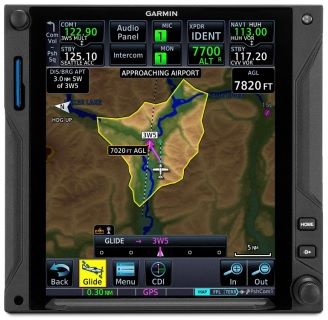
    I had never used the Garmin Smart Glide before, so I was eager to check it out during our training. When we got to engine failures, we pushed the Emergency button on the Home page of the GTN 750Xi, and then the magic happened.

    The plane was also equipped with a Garmin G600TXi PFD and the Garmin GFC 600 Autopilot. In order for Smart Glide to work, there has to be either a GTN 750Xi or GTN 650Xi installed, along with a G500TXi or G600TXi and a Garmin Autopilot. Garmin is working on getting the legacy G500 as well as the GI 275 and G5 to work with the above GPS units for Smart Glide as well.

    Here’s what happens. The plane loses it’s engine. The pilot’s workload and stress level suddenly goes way up. Trim the airplane for best glide, find the nearest airport, attempt restart. Do it quickly so you have time to focus on the glide. Oh yeah, squawk 7700 and declare your emergency. All the while plummeting toward the ground in a somewhat controlled crash. Yikes.

    Garmin Smart Glide takes over the flying part, allowing the pilot to handle the restart, while making it much easier to squawk, talk and plan the engine out landing. On the home page of the GTN 750Xi/650Xi, the pilot simply taps the Emergency icon on the bottom of the screen. The Autopilot comes on and goes into IAS mode and maintains best glide while descending. The GPS immediately analyzes the Glide Advisor, and turns to the nearest airport in the glide ring (if there is no airport within gliding distance, the GTN 750Xi advises the pilot). Then, the Autopilot flies directly to the Nearest airport, allowing the pilot the ability to take attempt a restart.

    Once it is determined that the engine won’t start, the Garmin Smart Glide has excellent situation awareness tools. On all screens, the pilot is constantly being advised of how high AGL the plane is currently, while advising also of how high AGL the plane will be over the airport that the glide is set up for. There is also a short cut on the screen to tap to squawk 7700 as well as runway length information at the airport.

    The Garmin Smart Glide Button wasn’t installed yet in the TBM, but that will make things even easier when it is (it will be certified in January). This is amazing technology that all Garmin GTN 750Xi pilots should have their software updated to. Remember, you have to have a Garmin Autopilot and a Garmin PFD for it all to work.

  • MAF Provides Disaster Relief in Haiti

    Hurricane Matthew rolled through the Caribbean last week and dumped vast amounts of rain across several of the island nations.  Haiti was one of them.  Haiti has been hard hit by disasters over the last 10 years.  Hurricane Ike in 2008, he devastating earthquake in 2010, Tropical Storm Isaac in 2012 and now Hurricane Matthew.

    maf-haiti

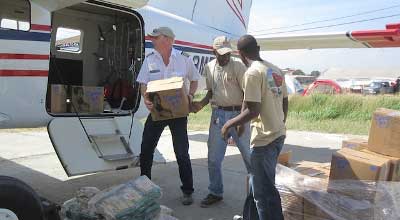
    MAF (Missionary Aviation Fellowship) has provided relief through all those disasters in Haiti.  Their disaster response team is preparing to provide relief yet again to the island nation in the form of relief supplies and personnel as well as damage assessment flights.

    MAF-US is based in Nampa, Idaho.  The organization uses aviation and technology to gain access to isolated people groups in order to allow those people to experience the love of Jesus Christ.  MAF-US serves in 6 countries around the world spread out amongst 15 bases.  MAF International works in 33 countries around the world.

    In addition, MAF works with multiple non-profits and human aid organizations to provide transportation to doctors and aid workers to those remote parts of the world where automobile transportation is impossible.

    In Haiti, MAF has 3 airplanes based in the country that serve 13 remote airstrips.  To read more about MAF, visit their website.

  • Thunderstorm Avoidance

    Thunderstorms are not to be taken lightly. I know you have probably heard that many times in your flying career. Weather related accidents account for approximately 25% of airline and GA accidents.

    The Airman’s Information Manual suggests giving a 20 mile berth around thunderstorms. If you are an experienced aviator or a newbie please take this piece of advice seriously. At one flight school where I taught, we had the policy of maintaining a 25 mile buffer around isolated thunderstorms. A bit excessive you think? Maybe, but safety is a good thing!

    On this particular day, I was operating a Bell Jet Ranger helicopter during a power line patrol. Power line patrol by itself offers numerous challenges. The job consists of flying along electric power transmission lines at approximately 40 feet above the ground at 40 knots. The crew consisted of me (the pilot) and an observer. The observer is an employee of the power company and it is his job to determine which line(s) will be patrolled during the given day. As I fly along the lines, the observer is checking for anything out of the ordinary such as broken, cracked, or even shot out insulators, excessively large bird nests at the top of structures, or woodpecker holes in wooden poles. The observer knows the lines and he is also a great help in letting me know there is a crossing, and potentially higher, line in our flight path. That makes him a true safety asset!
    Power line thunderstormIt was late afternoon during the summer and we were about to finish up for the day. We only had about another 10 miles of line to follow before calling it a day. Up ahead, I noticed an isolated thunderstorm near our power line. I could see the heavy rain falling below the anvil shaped leading clouds. It appeared to be well beyond the end of our day’s work so we pressed on.

    As we drew closer to the thunderstorm, we were suddenly tossed up on our left side like a dog toy in mid-flight! It seemed like we were 90 degrees to our normal cruise attitude and, to make it worse, we had the doors off on that hot summer day. I was able to recover and we did an immediate about face and high tailed it home. Forget the rest of that line, tomorrow is another day.

    The destructive force of thunderstorms cannot be overstated. In addition to extremely heavy rain, they can contain strong wind shear, large hail, and severe turbulence, each of which can damage or destroy an aircraft. Take care when one of these bad boys is near your flight path. Give it plenty of respect and a lots of room, for safety’s sake.

    Alan VanDoren is a 7000 hour ATP pilot.  He has flown both fixed wing and helicopters as a police pilot, missionary pilot, flight instructor, and most recently as an EMS pilot.  He has flown in five countries around the world and also teaches university level aviation courses in his spare time.

  • Determining Pattern Altitude

    Figuring out the pattern altitude at an airport should be pretty simple, right?  But, in this day of helpful technology, most pilots actually get it wrong.  How can you always get it right?  Well, it just takes about an extra 15 seconds.  Here’s how.

    Traffic Pattern
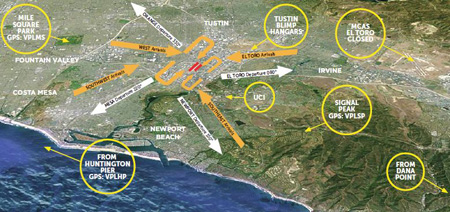
    John Wayne Airport Traffic Patterns

    As outlined in the Aeronautical Information Manual, section 4-3-3, “traffic pattern altitudes for propeller-driven aircraft generally extend from 600 feet to as high as 1,500 feet above the ground.”  Further, in the Pilot’s Handbook of Aeronautical Knowledge on page 13-10, it states:  “1,000 AGL is recommended pattern altitude unless established otherwise.”

    Okay, so for piston driver’s, we’ve got it narrowed down to 1,000 AGL (Above Ground Level for those who don’t like acronyms).  But wait!  There’s that very important phrase at the end of the last quote:  “unless established otherwise.”  That means not all airports have traffic pattern altitudes of 1,000 AGL, or else they wouldn’t put that line in there!

    How do you find out what the TPA (Traffic Pattern Altitude) is for a certain airport if it’s not 1,000 AGL?  Great question!  Your first guess is probably to look on Foreflight.  Though this is a good start, it is not the full answer.

    Let’s use an example.  Look up KAQO, the Llano Airport on Foreflight.  At the top of the page, the airport elevation is stated as 1,101′ MSL and the pattern altitude is stated as 1,902′ MSL.  From what we just learned, 1,902′ MSL is not 1,000 AGL, so is 1,902′ MSL otherwise established?

    On the Airports page with KAQO pulled up, tap the A/FD tab, second to last on the left.  Scroll down to Llano Muni.  Read the whole entry.  Does it state in the entry that pattern altitude is different than 1,000 AGL?  It sure doesn’t.  So, because it is not otherwise established, pattern altitude at KAQO is 2,102′ MSL not 1,902′ MSL.

    Where did Foreflight get that?  I have no idea.  Too often, though, pilots look at the Foreflight pattern altitude and don’t actually check the Airport Facilities Directory (A/FD).  Then, they get the pattern altitude wrong.

    What does it look like when pattern altitude is otherwise established?  Look up KSGR, Sugar Land Regional, on your Foreflight app.  Foreflight states the elevation as 82′ MSL and the Pattern Altitude as 1,000′ MSL.  Is this correct?  Well, tap that A/FD button again and let’s find out.

    On the second line of the A/FD entry, it says TPA-See Remarks.  Down in the remarks section, we find the following:

    TPA-1000 (918) single engine piston acft, TPA-1500 (1418) for twin and turbojet acft, TPA-500 (418) for helicopters within 2NM.

    Foreflight got it right this time for single engine pistons, but if you are in a twin, the pattern altitude is different.  What’s the lesson here?  Always check the A/FD and don’t always go by what Foreflight says.  The A/FD is always right and usually has a little more detail to help set you straight.

    One last thing.  Both the AIM and the Pilot’s Handbook of Aeronautical Knowledge, when talking about pattern altitude, state, “When operating at an airport, traffic pattern altitudes should be maintained unless otherwise required by the applicable distance from cloud criteria in…section 91.155.”  91.155 defines basic VFR weather minimums.  So, to fully interpret what the AIM is saying, we have to take into account the type of airspace we are in to determine if we can safely and legally operate at pattern altitude at a particular airport.

    For example, let’s say we are at KCVB, the Castroville Airport.  Pattern altitude there is 1,602 feet, which is 829 AGL.  CVB is Class G airspace up to 700 AGL, then Class E above that.  Let’s say there is a 700 AGL broken cloud layer.  Pattern altitude is 829 AGL, so you won’t be able to get up that high with a broken ceiling.  What altitude can you do pattern work at to stay legal?

    Class G VFR weather minimums during the day below 1,200 AGL is 1 SM visibility and clear of clouds.  So, legally, you could fly at 699 AGL (which at CVB would be 1,472 MSL) while in the pattern and be legal.  Safe?  Maybe, but probably not if you are skimming the base of the clouds.  Is 1300 MSL a safer pattern altitude in this example?  Well, that is 527 AGL, so probably not, since towers tend to stick up that high sometimes.

    Let’s go back to KSGR and put a 1,000 AGL overcast ceiling there.  SGR is Class D airspace and we already determined pattern altitude there was 1,000 MSL for piston singles.  VFR visibility and cloud clearance requirements in Class D airspace are 1,000 feet above clouds, 500 feet below clouds, and 2,000 feet horizontally from the clouds with 3 SM visibility.  In order to stay 500 feet below the clouds, you would be flying a 582 MSL pattern.  Safe?  Probably not, though it is legal.

    To summarize, don’t take Foreflight’s word for pattern altitude.  Cross reference the A/FD (it only takes 15 seconds at the most) to verify.  If it’s cloudy, it’s really best to stay on the ground, but if you want to find out your legal pattern altitude with a cloud deck, cross reference 91.155.  I don’t recommend flying below pattern altitude because it is there for a reason.

  • Stephanie Mertz Joins Texas Top Aviation

    Texas Top Aviation has added a new member to our instructing team. Stephanie Mertz was hired in March 2019 and will be specializing in G1000 & Instrument instruction.

    Stephanie graduated from LeTourneau University in Longview, Texas with a degree in Aeronautical Science, earning her commercial single and multi ratings while there. She began her aviation career in Ontario, California flying a Pilatus PC-12 for charter and medical trips. While operating the PC-12, she gained valuable experience flying all over the US and Mexico.

    In 2013, Stephanie moved back to East Texas with her husband where she worked as a contract pilot flying a variety of Citations as well as a Falcon 10. A few years later, she became involved in her local Ninety-Nines chapter and joined their mentorship program.

    After earning her CFI, CFII, and MEI, Stephanie returned to her alma mater to pass on her flying passions to college students through flight instructing. After a year of teaching at LeTourneau, she and her husband, with their first baby in tow, moved to the Austin area. Now she is instructing with Texas Top Aviation while acting as a mentor for other women working on achieving their flying dreams.

  • Jeppesen vs. Aeroservices Charts

    Many people ask, which set of charts is better? Should I use the FAA Aeroservices charts on Foreflight or pay extra for the Jeppesen charts? Since you have to pay for Jeppesen, they are probably better, right?

    I am not here to say which one is better as a chart preference is just that, a preference for one over the other or for certain features. After a while, muscle memory and routine take over and you probably wont even notice the difference.

    History

    In 1934, Elroy Jeppesen began making his own charts and sold them to other pilots. His little company grew into the giant Boeing chart company we know today. Jeppesen charts are used internationally and therefore include information that might otherwise seem common knowledge, like transition altitudes. The key is, you cannot get FAA Aeroservices charts for international destinations. Jeppesen is the only option for outside the US.

    National Aerospace Charting Office (NACO), or the new(er) name “Aeroservices” or FAA chart, whatever you decide to call them, are United States government issued charts. In addition to civilian use, Aeroservices charts are used by the military so there will be some terminology that does not apply to civilians. The best part about FAA Aeroservices charts are… they’re free!

    If you are in the middle of a transition or trying to decide which charts to use, you have come to the right place. Here are a few key differences.

    Obstacle Departure Procedure Chart
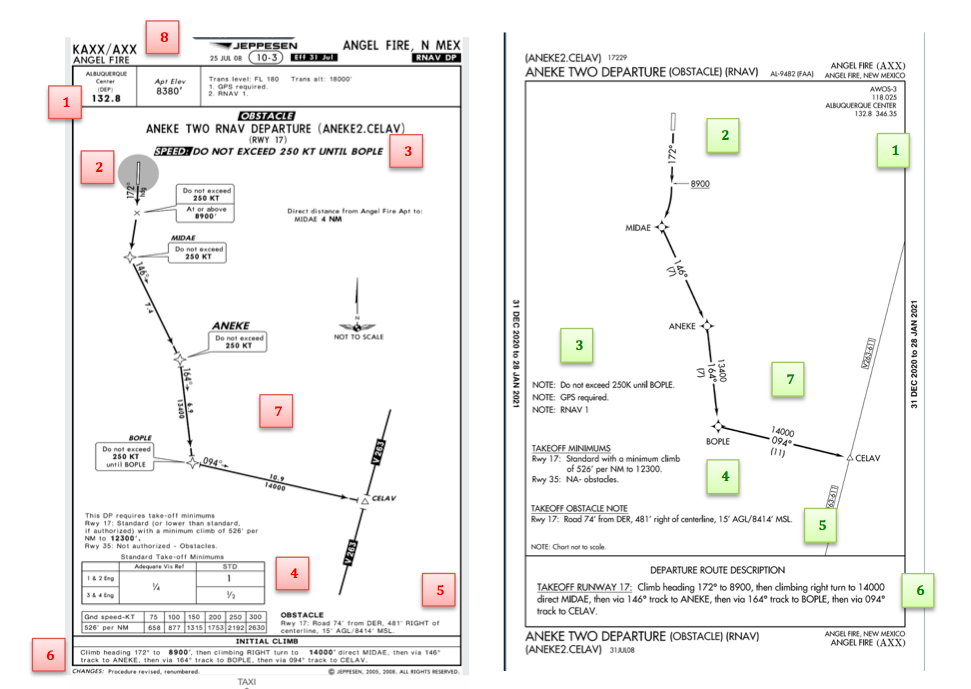
    KAXX (Angel Fire, New Mexico) ODP

    1. Frequencies: FAA Chart provides the AWOS so you have all departure frequencies in once place.
    2. Airport: Jeppesen highlight the airport, which is a nice feature so you can easily see the flow from the airport.
    3. Notes and Remarks: Jeppesen bolds the speed restriction all over the chart so you won’t miss it. All other requirements are in the top right corner. Note the transition altitude 18,000′. Since Jeppesen is used internationally, it is published on the chart since other countries have different transition altitudes. It takes up a chunk of chart real estate, but it’s clear, easy to read, and always in the same place. The FAA charts post all the requirements and restrictions as notes off to the side. Since it’s in the same space as the chart graphic, it’s easy for the eyes to catch while studying the plate.
    4. Take off Minimums: NOT APPLICABLE for PART 91 – however, it’s wise for all pilots to look and abide by them. Jeppesen displays the standard take off minimums table, as well as the rate of climb table, which is nice to have all in one place. The FAA chart gives the non standard information but you need to know/look up the rest in the Digital Terminal Procedures Supplemental document. (Hint: It’s in the Documents section of Foreflight)
    5. Take Off Obstacles: About the same on both charts
    6. Route Description: Similar on both charts, but larger font and clearer description on the FAA chart. When there are different routes from different runways, the FAA chart layout is really helpful.
    7. Graphic Layout: Jeppesen and FAA use the same graphics for all their different charts and plates which makes it easy to read once you are familiar with the respective charts. FAA charts are easy to read and distractions are kept to a minimum. Jeppesen charts make things bold and enlarge pertinent information so you won’t miss it.
    8. Airport altitude: This is only on the Jeppesen chart (the FAA chart doesn’t include it), but it is very helpful for situational awareness. As you brief the arrival altitudes, I think it’s important to have an idea what AGL you are at.

    Approach Charts

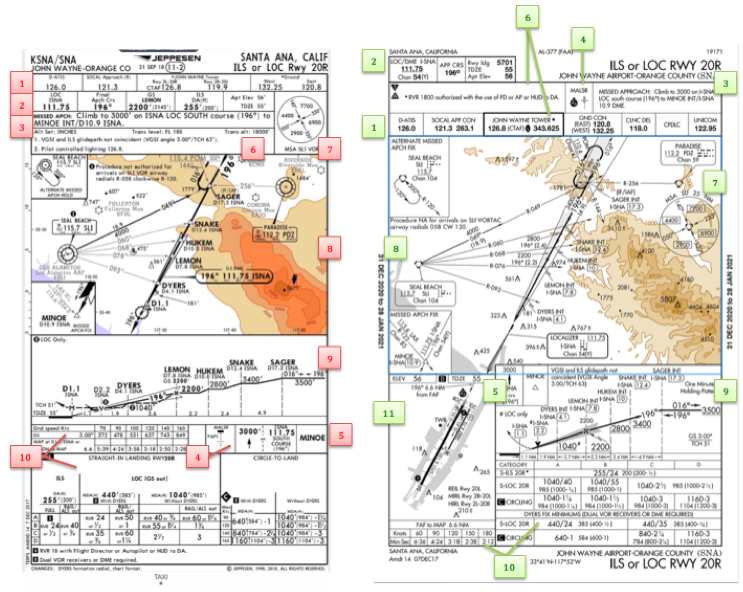
    One thing pilots love about Jeppesen approach charts is the clear set up for an approach brief. The top section is created as a “briefing strip” starting with the frequencies, then navigation frequencies, minimums, airport elevation and the missed approach. It’s very natural and user friendly.

    FAA charts have a slightly bigger picture of the approach planview, but the profile view and minimums section can get a bit cluttered. It can feel a little discontinuous when briefing the approach to bounce all over the page. However, some pilots really like the small airport diagram in the corner, which I find really helpful for situational awareness (particularly for students learning circle approaches). Non- standard alternate and takeoff minimums are also clearly noted, but unfortunately we must hunt elsewhere to find them. The Jeppesen alternate minimums and takeoff minimums will both be on the airport diagram

    1. Frequencies: Getting weather and tuning radios is easy on the Jeppesen charts – just follow the briefing strip. The frequency section on the FAA charts is still easy to read, but closer to the center of the page. It’s split up from the nav frequencies and other important briefing information.
      a. FAA charts are created by the government and have military specific information, which are the odd looking frequencies and channels on the chart.
    2. Approach Navigation: On a Jeppesen chart, you will continue to the next line to verify your frequency, course and set minimums (assuming you are straight in on the ILS). On the FAA chart, you will then have to skip to the top of the chart to get the frequency and course, and then scan to the bottom of the page to input your minimums. However, since you could be flying a localizer approach or a circle to land, it’s a good reminder that not everyone using this approach chart will be using the same Decision Altitude (DA). The FAA chart also includes runway distance information so pilots can make determinations of approach speeds and stopping distance if the runway is wet or icy.
    3. Missed Approach – Textual
    4. Approach Lighting
    5. Missed Approach- Graphical: The missed approach information is the same on both charts. The lighting information is key for determining a missed approach and is next to the missed approach text on the FAA chart. It’s found next to the missed approach graphic on the Jeppesen chart. Personally, I find it easier to find and read the lighting information on the Jeppesen chart. Remember, on both charts, the placement of the PAPI on the chart indicates the physical location of the lights (left or right of the runway).
    6. Notes: Both charts have a notes box, but they use them a little differently. Once again, remember that Jeppesen charts are used internationally and include the transition altitudes and altimeter setting info. On both charts, the notes section will be where other critical information will be shared which isn’t really applicable for this airport. On the FAA chart, the tower frequency is starred to note that there are operating hours (you’ll have to check the chart supplement AF/D to find out what those hours are). There is also an L next to the frequency to indicate it is the pilot controlled lighting frequency. You will also find the note about the VGSI and the Approach Glide path next to the profile view on the FAA chart, whereas the Jeppesen chart has that note in the notes section at the top. The FAA chart also has the T and an A in black triangles to note that this airport has non- standard alternate and take off minimums. Again, those are found in separate documents when using FAA charts and on the Airport Diagram when using Jeppesen charts.
    7. Minimum Sector Altitude: Similar on both charts, but in different locations (reminder: ATC vector altitudes may be lower. It is the pilot’s responsibility for safety of flight to maintain safe obstacle clearance, so if you are ever concerned about going below the MSA – just ask ATC).
    8. Planview: Other then differences in size, visuals, and text, the information displayed on both is very similar.
    9. Profile View: Again, the displays look different and pilots will have their preference, but the information is the same.
    10. Minimums: Jeppesen charts not only note the category for each approach with its designated letter, but also displays it in knots. It is recommended that if you increase your approach speed (based on flaps or gusty winds or perhaps a faster speed for a circle to land approach) that you should use the higher category minimums. The reference guide makes that easy to look up. The other benefit of the Jeppesen charts is right the table that contains the time from the final approach fix to the missed approach point for a localizer approach, it also shows the rate of descent with the associated ground speed to maintain a 3 degree glideslope. Now there is no excuse not to set pitch and power! The minimums posted in parenthesis are for the military, but RVR in statute miles is also included.
    11. Airport diagram: Only on the FAA charts, this particular feature is particularly useful for situational awareness. The arrow pointing to the runway shows the direction the approach is arriving from so planning a circle to land is a cinch. There is also a lot of other information that can be gathered from the airport diagram for quick reference or to help a disoriented pilot: lighting, displaced thresholds, closed taxiways, and runway placement and lengths. This is easily one of the best perks of an FAA chart.

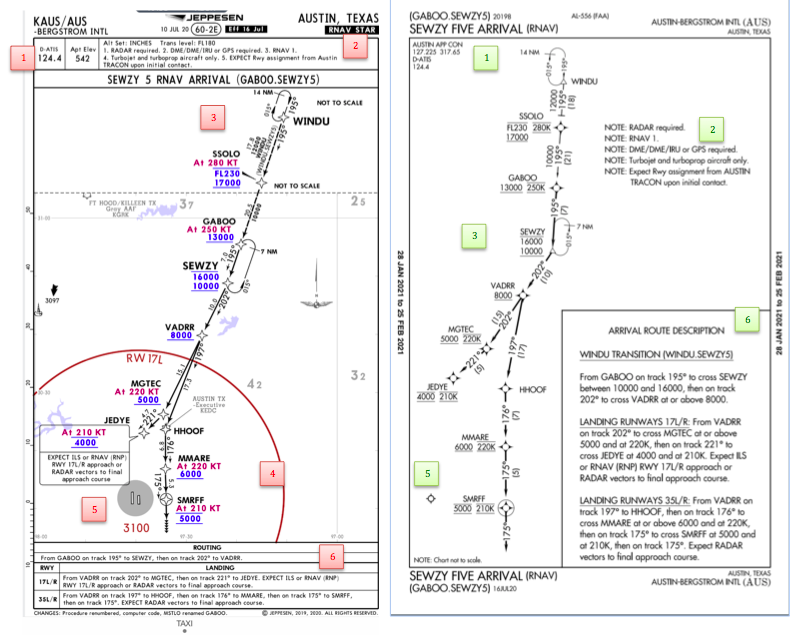
    Arrival/ Departure Charts: Sewzy 5 Arrival KAUS

    The Jeppesen lay out is very attractive and draws the pilots eye in a clear way to all the important information. The colors pop out, so the required altitudes and speeds are easy to read and remember. The chart, which is the proper scale, shows MORAs , easy to find airports (and runway layouts) and is over all easy to follow. However, the texts, while very clearly laid out, are small and difficult to read and pushed to the very edges of the chart. FAA charts are simple and fairly easy to read, but the airports are not as obvious and the flow to the airport requires a good look. The table on the Jeppesen chart is a really nice format, but the text and Notes for arrivals on the FAA chart are easy to find and much easier to read quickly.

    1. Frequency: FAA charts include the approach frequency on the arrival, which is helpful for having radios tuned. During a busy time when the controller changes your frequency, all you have to do is verify the frequency you already set, rather then totally stop what you’re doing to switch it. The Jeppesen charts add the airport elevation next to the ATIS, which really aids situational awareness.
    2. Notes: Jeppesen notes are clearly numbered and tucked away nicely in a box, but the FAA chart notes pop out in the middle of the page and are easy to skim for pertinent information.
    3. Planview: I think Jeppesen is the clear winner here- it is so easy to read, it only takes one glance to know where the primary airport is and how the arrival flows. The chart being at the proper scale offers the pilot important geographical information and over all is a clean look. Notice the small series of arrows after SMRFF on the the Jeppesen chart; those indicate the pilot should expect radar vectors. The FAA charts include those instructions in the text, but I find the visual reference on the chart helpful. The FAA charts are equally clean, with altitude and speed restrictions easy to read even if they don’t jump out. When there are multiple airports that the arrival serves, the airports are clearly marked, though, I think it would be nice to have a little more information surrounding the primary airport for better situational awareness.
    4. MSA: only on the Jeppesen chart
    5. Primary airport: The runway alignment and grey highlight on the Jeppesen chart stands out very clearly, while the FAA airports are a little more obscure.
    6. Arrival route description: The table on the Jeppesen chart is easy to follow but the text is very small and pushed to the bottom. The route description is much easier to find and read on the FAA chart.

    Airport Diagram

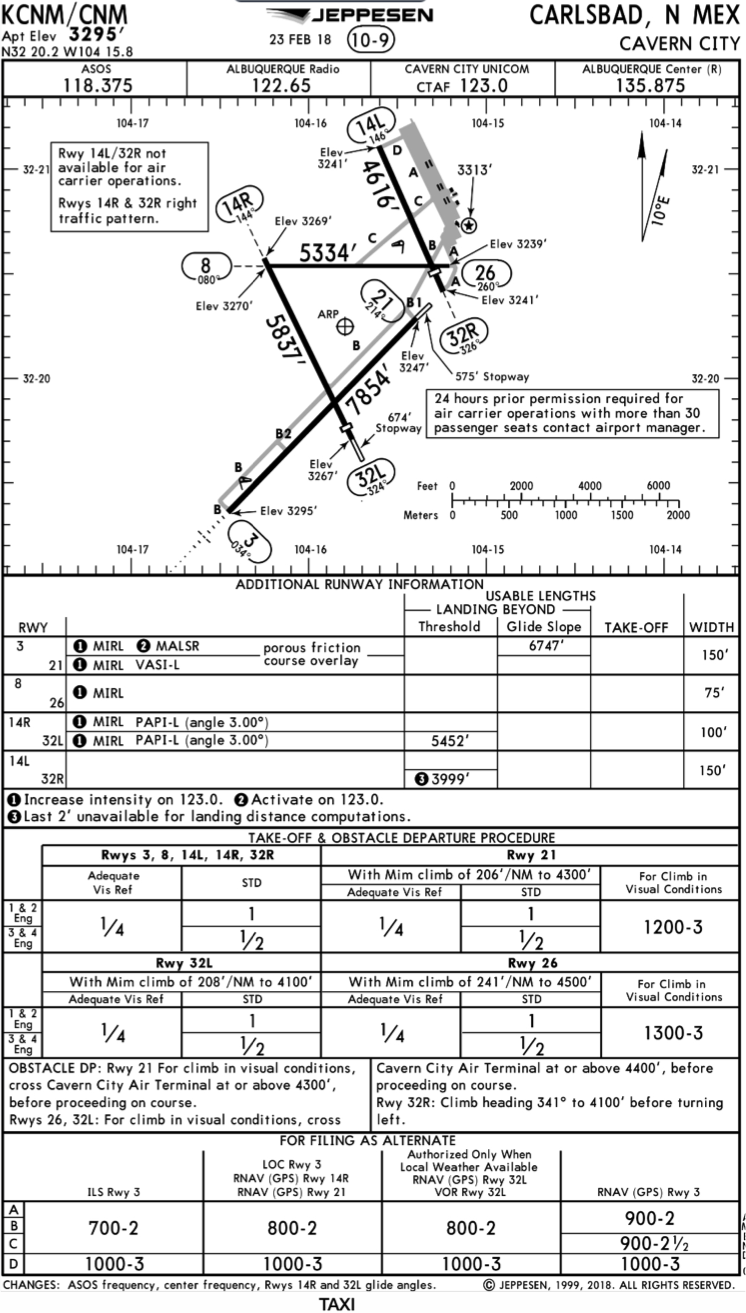
    The Jeppesen Airport Diagram page has it all: frequencies, airport diagram, runway info, take-off minimums, departure procedures and alternate minimums. It’s a one-stop shop. It makes preflight planning easy when its all at your fingertips.

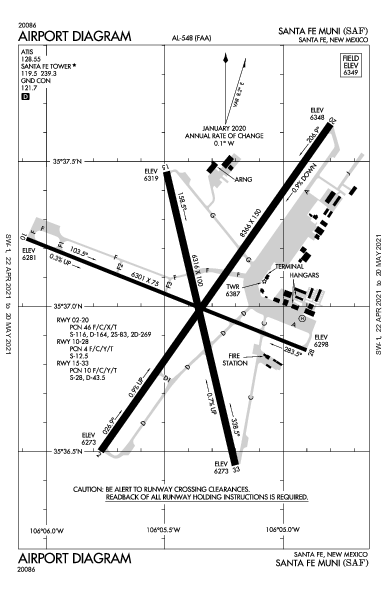
    The FAA charts usually require a little more searching for different pieces of airport information. The Airport Diagram itself is just the airport layout. Above, you will see a simple FAA Airport diagram. It’s clean and simple, perfect for a knee board print out.

    In the flight planning process, as you look at what approaches you will be using for the airport, you might see an A or T inside a triangle. Those indicate that you will need to look in the Alternate Minimum or Take off minimum documents for more information. The Takeoff Minimums document (see below) is also where you will find any obstacle departure procedures for that airport. Apps like Foreflight help you out by posting the take off minimums under the departure tab. Even though it’s a little more difficult to read, I didn’t crop out the airport information so you can see what it looks like in context.

    FAA Alternate Minimums on the Left and Takeoff Minimums and Obstacle Departure Procedures on the Right

Leave a Reply

Your email address will not be published. Required fields are marked *