| |

Utilizing Personal Minimums

The FAA defines personal minimums “as an individual pilot’s set of procedures, rules, criteria, and guidelines for deciding whether and under what conditions to operate (or continue operating) in the National Airspace System.” Have you actually given thought as to why we choose the personal minimums we do? From the beginning of initial pilot training, weather minimums were established for day-to-day training and during solo flight. I didn’t realize it at first, but I later learned these limits were not just an insurance mandate, but these minimums were set at the time to safely operate an aircraft based on my “then” current experience.

So here’s the question: what are your personal minimums and WHY do YOU have them? Do you ever lower or raise your minimums? Are your minimums based solely on your overall experience level or do they take into account other variables such as advanced avionics? For pilots that fly multiple aircraft like I do, can and do your minimums change in regard to category or type of aircraft you are flying? It’s a judgment decision on how you chose your minimums. However, it’s important that time is taken before you strap into the cockpit for each flight to critically think about the different risk factors and variables which may affect your decision for the minimums you choose.

To guide us, let’s try briefly apply the FAA’s Personal Minimums Checklist to see how risk factors might shape what personal minimums or decisions we make for the day. Remember, just because you have been flying with a certain set of minimums one day, doesn’t mean you can’t adjust your minimums to a higher value given an ever-changing situation.

The acronym most pilots have heard is PAVE:
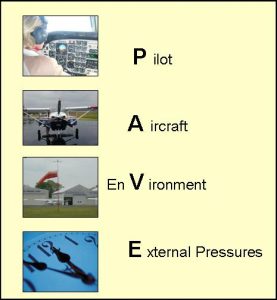
Pilot– We all should be familiar with the acronym IMSAFE associated with this. It addresses variables such as Illness, Medication, Stress, Alcohol, Fatigue, and Emotion. But how do you adjust your personal minimums using this guideline? Have you ever thought about raising your minimums for a training flight if you only got 4-6 hours of sleep, instead of 8? Or if you anticipate a hard IFR flight with a long day, maybe taking a safety pilot to mitigate the chance of a mistake if you’re forecasting having to shoot an approach to your weather planning minimums.

Aircraft– Personally, this is a really important factor for me when deciding what minimums to apply. I often spend a large majority of my time asking myself; is this aircraft properly equipped for the flight? This question goes beyond just looking at the logbook for a properly equipped and legal aircraft. A professional pilot should think further. Am I flying a traditional 6-pack “steam gauge” layout, non-slaved compass card, with a separate OBS gauge for course guidance? What if the aircraft doesn’t have an auto-pilot? What if I’m flying an aircraft equipped with a dual auto-pilot, dual GPS with an integrated glass cockpit? I can comfortably say my personal minimums change depending on the equipment I have available.

A pilot should also look at his/her recency with the aircraft. For example, if you are qualified to fly both airplanes and helicopters, maybe you should choose to have higher personal minimums in one particular airframe or if you haven’t flown that airframe within 30, 60 or 90 days. This is a very important factor for the owner/pilot.

EnVironment– Most of the time, when we think of environment, we ask ourselves, is the weather legal for me to take off and, more importantly, can I conduct this flight safely? Basic flight planning should have taught us to take into consideration crosswind limits, day versus night, and the type of airspace the flight is conducted in. Thought should also be given to how you set your personal minimums in regards to the particular type of environment you might rarely encounter. Flying an approach to your minimums in the flat plains of Texas during the day is one thing, but how would you adjust your weather minimums flying to a new airport, at night, with no moon illumination, in the mountains of Colorado? Could you reduce the risk and adjust your minimums in this scenario with two pilots?

External Pressures – What external pressures are affecting your flight? Passengers, the owner, “get-there-it is”, the desire to impress someone? Although external pressures should never be a factor when conducting a flight, they almost always play a role in your decision whether to conduct the flight or not. For example, a professional pilot gets hired to do a flight and the weather is below their personal minimums. The pilot could be tempted to lower their minimums by 100 feet to take the flight for a paying customer. This scenario plays out every day across the country whether it’s a professional pilot or owner/pilot. It would be foolish not to consider this type of pressure. Always make sure you have a plan if and when you encounter this situation. Planning your flight and having a plan to deal with these potential scenarios ahead of time ensures you stick to your minimums. It can be as simple as telling your passengers, or the owner, well ahead of your flight what your personal minimums are to accept the flight, and to ensure they, or you, have a back-up plan!

Most pilots will never break a hard limitation such as an airframe cross wind limitation, or engine limit, but the chances of breaking a personal minimum are realistic. Think about the last time you went on a diet and broke your plan because you were tempted by your friends or family during an outing. Self-imposed personal minimums can be hard to enforce and we need to acknowledge this as humans. Here are a few techniques that you can use to assist in making a decision using personal minimums and help reduce the influence of external pressures.

Step 1: Sit down with your CFI/CFII and fill out a personal minimums worksheet. Filling one out by yourself is a good start but having an outside objective view will help in making sure your personal minimums are realistic. Remember, it is easy to convince ourselves that we can do something even though we have set personal minimums. Talk with other pilots to see if you have set realistic expectations.

Step 2: Preflight planning must start a few days in advanced. It can be as easy as checking what the forecast might be and looking at the projected route, near-by alternate airports, and various approaches. This can be done quickly and will give you a heads up on whether the flight can be safely conducted or not. By alerting the passengers or owner early enough, alternate plans can be developed. An extra pilot can be added, the passengers can fly commercial, bring along a CFI, or cancel the trip altogether and seek alternate transportation. The main point is the decision was made well ahead of the flight when conditions didn’t look favorable. This helps in removing external pressures and ensures you don’t go below your personal minimums.

Step 3: Never be afraid to ask for a second opinion. Part 135 operators have set procedures for conducting flights which assist the pilots in making decisions. These set procedures help remove external pressures by allowing the pilot to say, “The rules don’t allow for this, or this is how we will conduct the flight!” However, under Part 91, the pilot has to take ownership for all phases of the flight. This is where talking it out with another pilot helps with mitigating external factors and the environment. Ideally, this person should have more experience and be able to talk through the situation. For instance, if I’m flying to a new destination, I often seek the advice from another pilot who’s familiar with the area. They may have key insights into weather patterns, preferred approaches, or hazards to avoid. In certain situations, asking for another pilot’s opinion might be what influences your go/no-go decision! You’ll be amazed how much you can learn just from talking to other pilots.

Step 4: Continue to build your experience and knowledge base. Building experience requires us to push our abilities, and sometimes this may be to the limit. However, this can be done in a controlled training environment or just going out and experiencing it. Get a new license, fly regularly with a CFI/CFII, and always try and take advantage of training opportunities. For example on your next flight from point A to point B, practice hand flying an approach, do a short field landing, a quick steep turn, etc. Quality flight time is always better than quantity. Continue to challenge yourself and try not to become complacent.
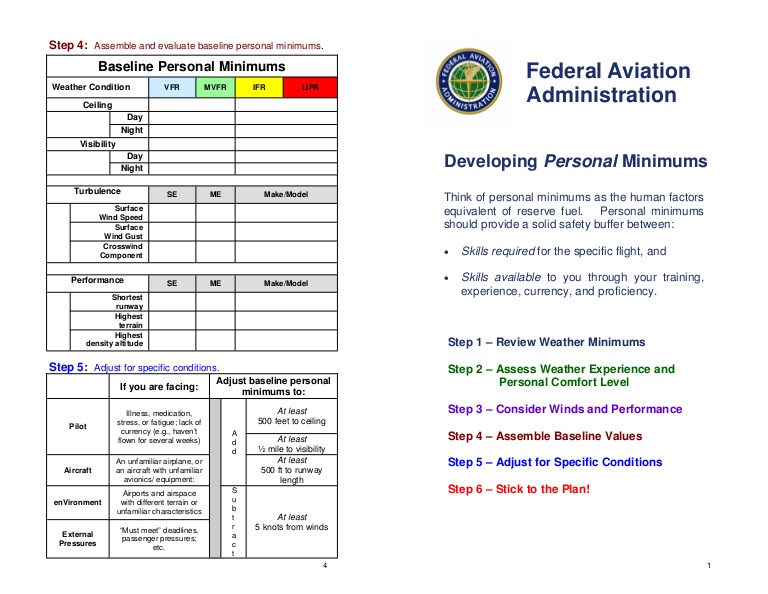
Personal minimums are a tool to assist in every pilot’s aeronautical decision making process. Use your personal minimums to guide your final go/no-go decision and remember to stick to the plan. I encourage you to review the FAA’s Risk Management Handbook (FAA-H-8083-2). Appendix B has Sample Risk Management Scenarios and reviewing them will give a better understanding how to apply the techniques discussed to your everyday flying.


Pedro Vargas-Lebron is a King Air 200 and uH-60 Blackhawk Instructor pilot with the Texas Army National Guard. Pedro is a CFI/CFII/MEI both in airplanes and helicopters with over 4000 hours of flight time, half as an instructor pilot.

Similar Posts

  • Chuck’s Aircraft 10 Year Anniversary Fly In

    Chuck’s Aircraft, the Austin Cirrus Service Center located at the Austin Executive Airport (KEDC), is celebrating it’s 10 year anniversary this month. What better what to celebrate than to fly in for Texas BBQ? That’s what they thought too!

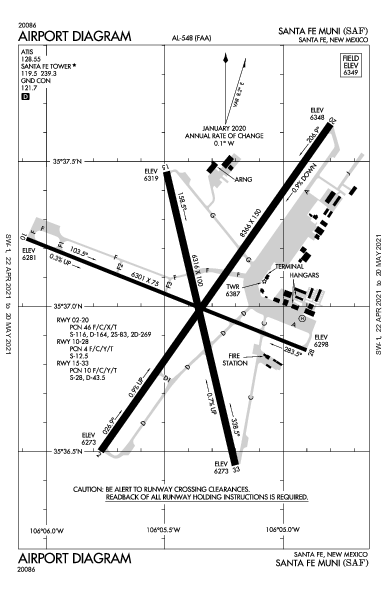
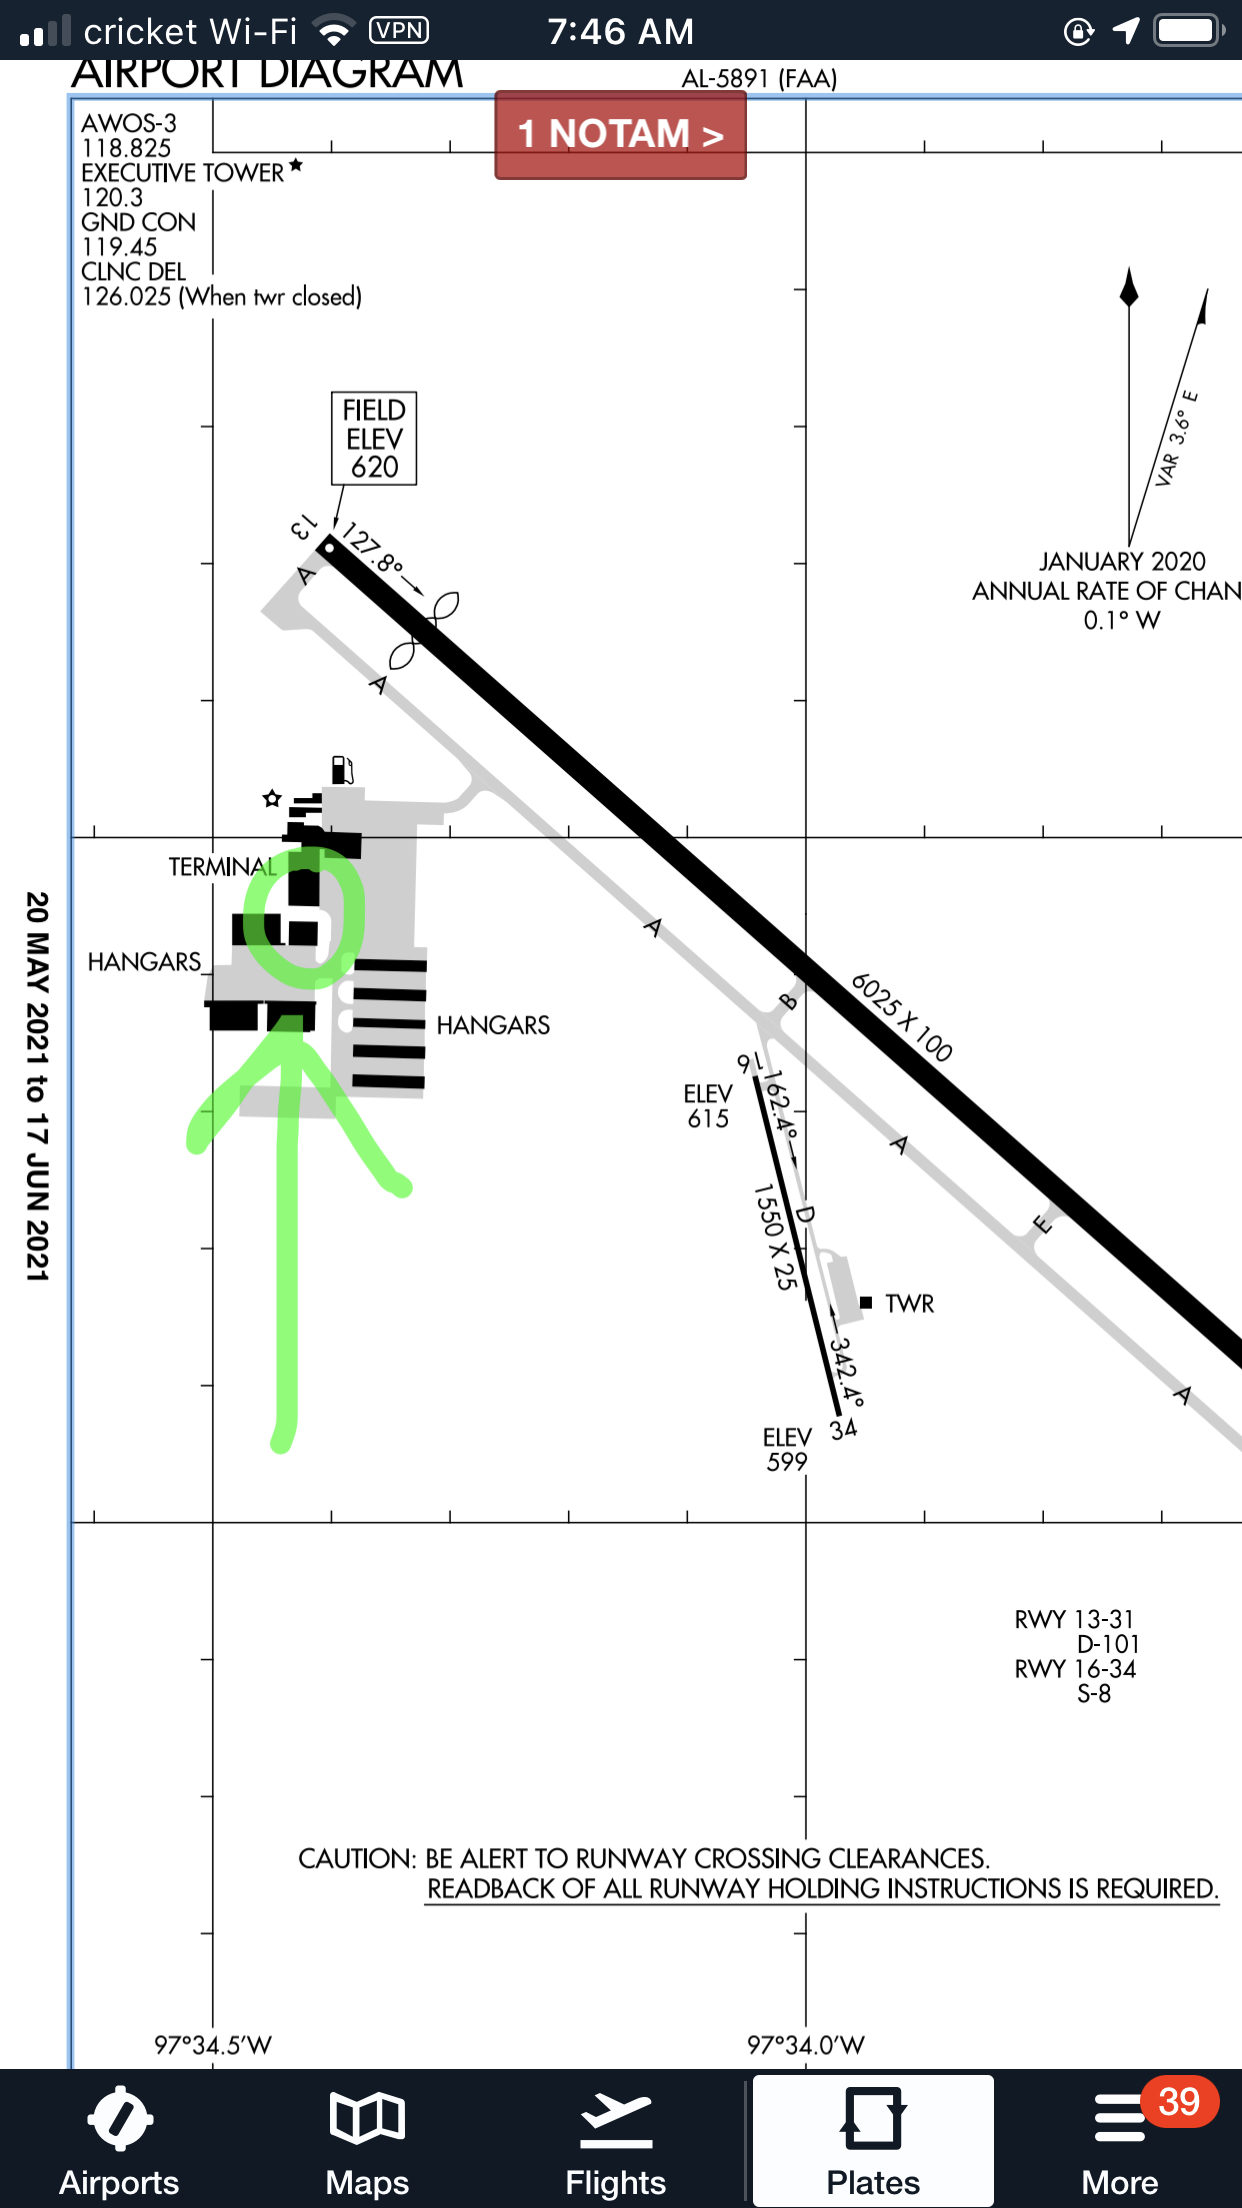
    Chuck’s Aircraft will be hosting its 10 Year Anniversary Fly In on Friday, June 25th from 1pm to 5pm on their ramp at EDC (see airport diagram below). Chuck’s Aircraft always provides quality maintenance for Cirrus and other aircraft, so come show your appreciation for them.

    Please RSVP to erin@chucksaircraftllc.com. Hope to see you there!!!

    Chuck’s Aircraft is the hangar circled in green
  • King Schools Updates Check Ride Guidance

    King Schools LogoMost in the aviation industry are familiar with John and Martha King, the faces of the myriad of Kings Schools aviation training courses.  Thousands of pilots have gone through their ground school courses for a variety of certificates or ratings, taking in the videos on original VHS, DVD, or streaming online depending on what the current technology is.

    With the advent of the Airmen Certification Standards (ACS) replacing the Practical Test Standards (PTS) for the private and instrument certificates, King Schools didn’t take long to update their material.

    To help private students prepping for their check ride (and their instructors who aren’t familiar with an ACS check ride yet), John King plays the student pilot in the latest King Schools prep video.  The streaming online video is about 5 hours long, includes the oral portion and the flight portion of the check ride, and runs $139 (you can still get the DVD, too!).

    I have recommended King Schools and their courses to all of my customers.  They have always put out a great product as they reduce the fear felt for a check ride applicant.  If you are prepping for your private pilot check ride, checkout the King Schools video today.

  • Jeppesen vs. Aeroservices Charts

    Many people ask, which set of charts is better? Should I use the FAA Aeroservices charts on Foreflight or pay extra for the Jeppesen charts? Since you have to pay for Jeppesen, they are probably better, right?

    I am not here to say which one is better as a chart preference is just that, a preference for one over the other or for certain features. After a while, muscle memory and routine take over and you probably wont even notice the difference.

    History

    In 1934, Elroy Jeppesen began making his own charts and sold them to other pilots. His little company grew into the giant Boeing chart company we know today. Jeppesen charts are used internationally and therefore include information that might otherwise seem common knowledge, like transition altitudes. The key is, you cannot get FAA Aeroservices charts for international destinations. Jeppesen is the only option for outside the US.

    National Aerospace Charting Office (NACO), or the new(er) name “Aeroservices” or FAA chart, whatever you decide to call them, are United States government issued charts. In addition to civilian use, Aeroservices charts are used by the military so there will be some terminology that does not apply to civilians. The best part about FAA Aeroservices charts are… they’re free!

    If you are in the middle of a transition or trying to decide which charts to use, you have come to the right place. Here are a few key differences.

    Obstacle Departure Procedure Chart
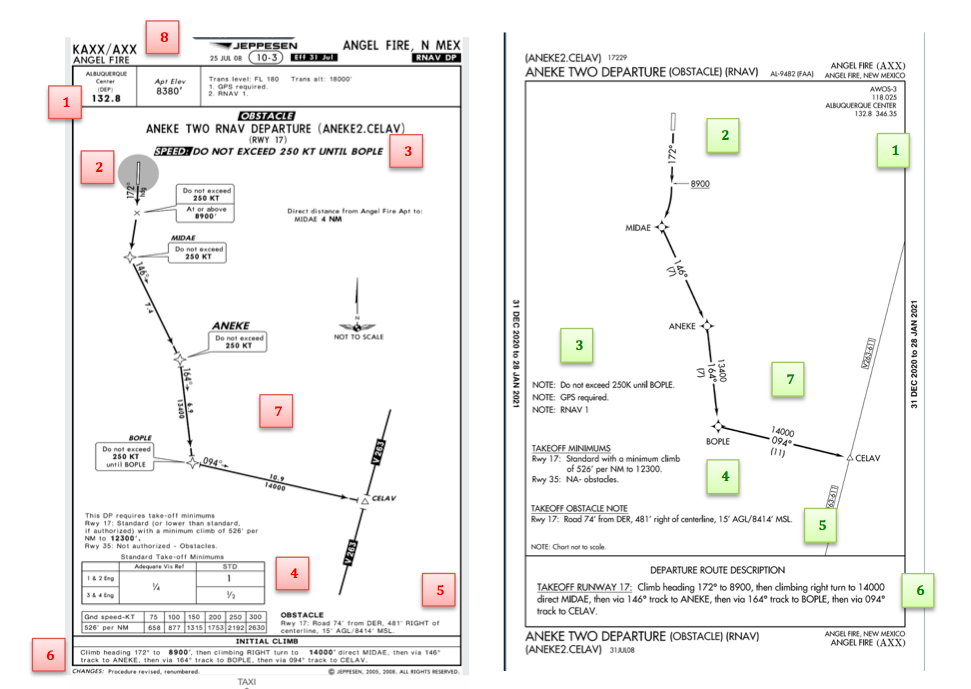
    KAXX (Angel Fire, New Mexico) ODP

    1. Frequencies: FAA Chart provides the AWOS so you have all departure frequencies in once place.
    2. Airport: Jeppesen highlight the airport, which is a nice feature so you can easily see the flow from the airport.
    3. Notes and Remarks: Jeppesen bolds the speed restriction all over the chart so you won’t miss it. All other requirements are in the top right corner. Note the transition altitude 18,000′. Since Jeppesen is used internationally, it is published on the chart since other countries have different transition altitudes. It takes up a chunk of chart real estate, but it’s clear, easy to read, and always in the same place. The FAA charts post all the requirements and restrictions as notes off to the side. Since it’s in the same space as the chart graphic, it’s easy for the eyes to catch while studying the plate.
    4. Take off Minimums: NOT APPLICABLE for PART 91 – however, it’s wise for all pilots to look and abide by them. Jeppesen displays the standard take off minimums table, as well as the rate of climb table, which is nice to have all in one place. The FAA chart gives the non standard information but you need to know/look up the rest in the Digital Terminal Procedures Supplemental document. (Hint: It’s in the Documents section of Foreflight)
    5. Take Off Obstacles: About the same on both charts
    6. Route Description: Similar on both charts, but larger font and clearer description on the FAA chart. When there are different routes from different runways, the FAA chart layout is really helpful.
    7. Graphic Layout: Jeppesen and FAA use the same graphics for all their different charts and plates which makes it easy to read once you are familiar with the respective charts. FAA charts are easy to read and distractions are kept to a minimum. Jeppesen charts make things bold and enlarge pertinent information so you won’t miss it.
    8. Airport altitude: This is only on the Jeppesen chart (the FAA chart doesn’t include it), but it is very helpful for situational awareness. As you brief the arrival altitudes, I think it’s important to have an idea what AGL you are at.

    Approach Charts

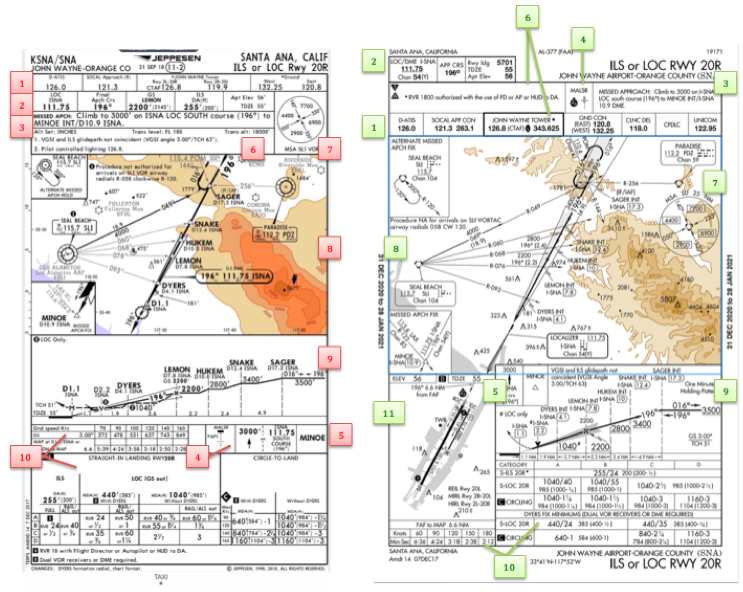
    One thing pilots love about Jeppesen approach charts is the clear set up for an approach brief. The top section is created as a “briefing strip” starting with the frequencies, then navigation frequencies, minimums, airport elevation and the missed approach. It’s very natural and user friendly.

    FAA charts have a slightly bigger picture of the approach planview, but the profile view and minimums section can get a bit cluttered. It can feel a little discontinuous when briefing the approach to bounce all over the page. However, some pilots really like the small airport diagram in the corner, which I find really helpful for situational awareness (particularly for students learning circle approaches). Non- standard alternate and takeoff minimums are also clearly noted, but unfortunately we must hunt elsewhere to find them. The Jeppesen alternate minimums and takeoff minimums will both be on the airport diagram

    1. Frequencies: Getting weather and tuning radios is easy on the Jeppesen charts – just follow the briefing strip. The frequency section on the FAA charts is still easy to read, but closer to the center of the page. It’s split up from the nav frequencies and other important briefing information.
      a. FAA charts are created by the government and have military specific information, which are the odd looking frequencies and channels on the chart.
    2. Approach Navigation: On a Jeppesen chart, you will continue to the next line to verify your frequency, course and set minimums (assuming you are straight in on the ILS). On the FAA chart, you will then have to skip to the top of the chart to get the frequency and course, and then scan to the bottom of the page to input your minimums. However, since you could be flying a localizer approach or a circle to land, it’s a good reminder that not everyone using this approach chart will be using the same Decision Altitude (DA). The FAA chart also includes runway distance information so pilots can make determinations of approach speeds and stopping distance if the runway is wet or icy.
    3. Missed Approach – Textual
    4. Approach Lighting
    5. Missed Approach- Graphical: The missed approach information is the same on both charts. The lighting information is key for determining a missed approach and is next to the missed approach text on the FAA chart. It’s found next to the missed approach graphic on the Jeppesen chart. Personally, I find it easier to find and read the lighting information on the Jeppesen chart. Remember, on both charts, the placement of the PAPI on the chart indicates the physical location of the lights (left or right of the runway).
    6. Notes: Both charts have a notes box, but they use them a little differently. Once again, remember that Jeppesen charts are used internationally and include the transition altitudes and altimeter setting info. On both charts, the notes section will be where other critical information will be shared which isn’t really applicable for this airport. On the FAA chart, the tower frequency is starred to note that there are operating hours (you’ll have to check the chart supplement AF/D to find out what those hours are). There is also an L next to the frequency to indicate it is the pilot controlled lighting frequency. You will also find the note about the VGSI and the Approach Glide path next to the profile view on the FAA chart, whereas the Jeppesen chart has that note in the notes section at the top. The FAA chart also has the T and an A in black triangles to note that this airport has non- standard alternate and take off minimums. Again, those are found in separate documents when using FAA charts and on the Airport Diagram when using Jeppesen charts.
    7. Minimum Sector Altitude: Similar on both charts, but in different locations (reminder: ATC vector altitudes may be lower. It is the pilot’s responsibility for safety of flight to maintain safe obstacle clearance, so if you are ever concerned about going below the MSA – just ask ATC).
    8. Planview: Other then differences in size, visuals, and text, the information displayed on both is very similar.
    9. Profile View: Again, the displays look different and pilots will have their preference, but the information is the same.
    10. Minimums: Jeppesen charts not only note the category for each approach with its designated letter, but also displays it in knots. It is recommended that if you increase your approach speed (based on flaps or gusty winds or perhaps a faster speed for a circle to land approach) that you should use the higher category minimums. The reference guide makes that easy to look up. The other benefit of the Jeppesen charts is right the table that contains the time from the final approach fix to the missed approach point for a localizer approach, it also shows the rate of descent with the associated ground speed to maintain a 3 degree glideslope. Now there is no excuse not to set pitch and power! The minimums posted in parenthesis are for the military, but RVR in statute miles is also included.
    11. Airport diagram: Only on the FAA charts, this particular feature is particularly useful for situational awareness. The arrow pointing to the runway shows the direction the approach is arriving from so planning a circle to land is a cinch. There is also a lot of other information that can be gathered from the airport diagram for quick reference or to help a disoriented pilot: lighting, displaced thresholds, closed taxiways, and runway placement and lengths. This is easily one of the best perks of an FAA chart.

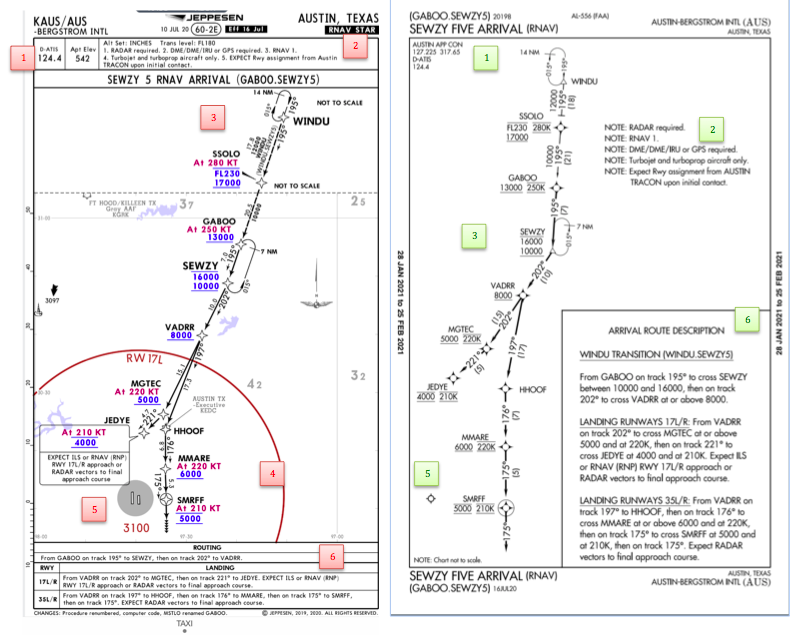
    Arrival/ Departure Charts: Sewzy 5 Arrival KAUS

    The Jeppesen lay out is very attractive and draws the pilots eye in a clear way to all the important information. The colors pop out, so the required altitudes and speeds are easy to read and remember. The chart, which is the proper scale, shows MORAs , easy to find airports (and runway layouts) and is over all easy to follow. However, the texts, while very clearly laid out, are small and difficult to read and pushed to the very edges of the chart. FAA charts are simple and fairly easy to read, but the airports are not as obvious and the flow to the airport requires a good look. The table on the Jeppesen chart is a really nice format, but the text and Notes for arrivals on the FAA chart are easy to find and much easier to read quickly.

    1. Frequency: FAA charts include the approach frequency on the arrival, which is helpful for having radios tuned. During a busy time when the controller changes your frequency, all you have to do is verify the frequency you already set, rather then totally stop what you’re doing to switch it. The Jeppesen charts add the airport elevation next to the ATIS, which really aids situational awareness.
    2. Notes: Jeppesen notes are clearly numbered and tucked away nicely in a box, but the FAA chart notes pop out in the middle of the page and are easy to skim for pertinent information.
    3. Planview: I think Jeppesen is the clear winner here- it is so easy to read, it only takes one glance to know where the primary airport is and how the arrival flows. The chart being at the proper scale offers the pilot important geographical information and over all is a clean look. Notice the small series of arrows after SMRFF on the the Jeppesen chart; those indicate the pilot should expect radar vectors. The FAA charts include those instructions in the text, but I find the visual reference on the chart helpful. The FAA charts are equally clean, with altitude and speed restrictions easy to read even if they don’t jump out. When there are multiple airports that the arrival serves, the airports are clearly marked, though, I think it would be nice to have a little more information surrounding the primary airport for better situational awareness.
    4. MSA: only on the Jeppesen chart
    5. Primary airport: The runway alignment and grey highlight on the Jeppesen chart stands out very clearly, while the FAA airports are a little more obscure.
    6. Arrival route description: The table on the Jeppesen chart is easy to follow but the text is very small and pushed to the bottom. The route description is much easier to find and read on the FAA chart.

    Airport Diagram

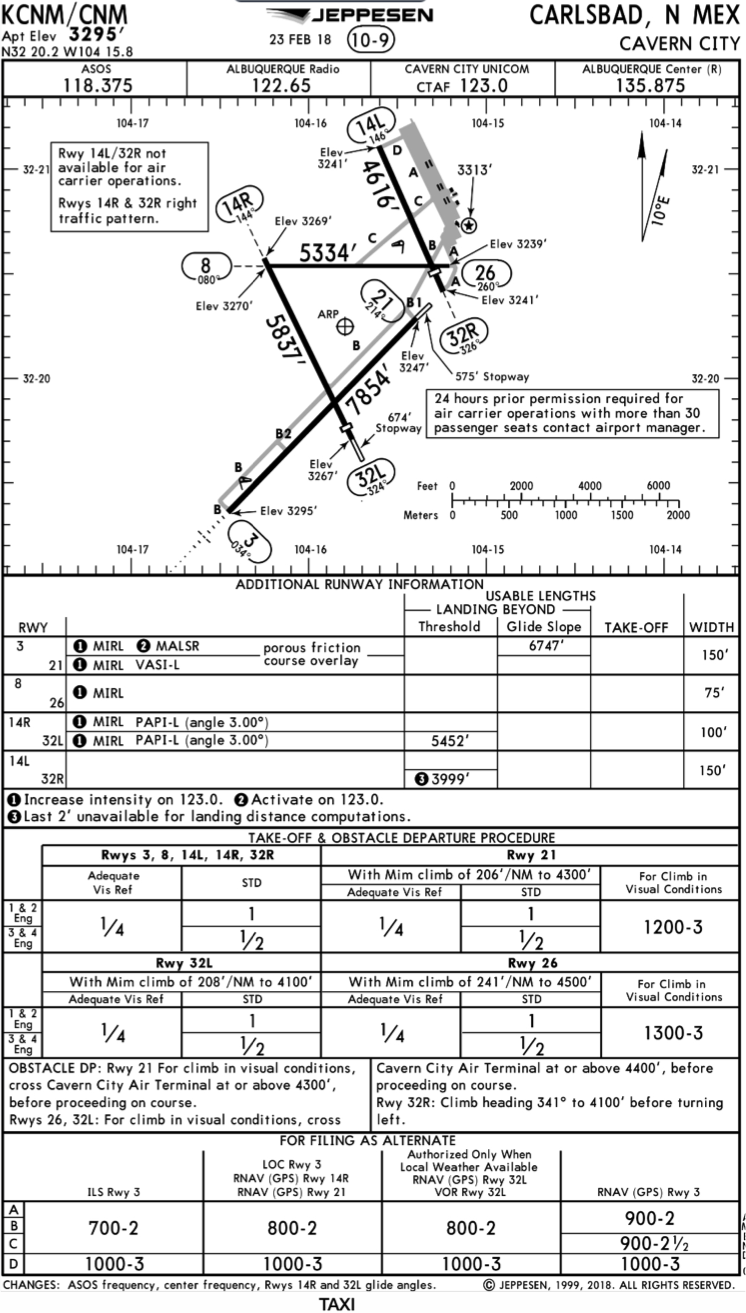
    The Jeppesen Airport Diagram page has it all: frequencies, airport diagram, runway info, take-off minimums, departure procedures and alternate minimums. It’s a one-stop shop. It makes preflight planning easy when its all at your fingertips.

    The FAA charts usually require a little more searching for different pieces of airport information. The Airport Diagram itself is just the airport layout. Above, you will see a simple FAA Airport diagram. It’s clean and simple, perfect for a knee board print out.

    In the flight planning process, as you look at what approaches you will be using for the airport, you might see an A or T inside a triangle. Those indicate that you will need to look in the Alternate Minimum or Take off minimum documents for more information. The Takeoff Minimums document (see below) is also where you will find any obstacle departure procedures for that airport. Apps like Foreflight help you out by posting the take off minimums under the departure tab. Even though it’s a little more difficult to read, I didn’t crop out the airport information so you can see what it looks like in context.

    FAA Alternate Minimums on the Left and Takeoff Minimums and Obstacle Departure Procedures on the Right
  • The Aunt Betty Directive: PFD Failures

    Glass panel displays, ballistic parachute aircraft recovery systems, portable tablet computers enabling paperless cockpits, and widely available three axis autopilot systems have changed the way we fly, the way we train, and the way we are expected to perform on check rides. Our training and testing paradigms have tried to stay in synch, yet always seem to be catching up to the latest levels of technology.

    This is very apparent when we instructors are preparing a student for an FAA practical test. When training aircraft had no autopilots, no GPS, and certainly no parachutes, the general philosophy was that during training, the student should have the lowest level of technology available. This was also the expectation on the check ride. This theory has changed over the years and now the Practical Test Standards require that an applicant integrate all available technology while demonstrating mastery of his or her aircraft. This raises numerous questions from instructors and students about what technology will be available for each task.

    One example of this dilemma is found when contemplating an instrument airplane practical test in a Cirrus SR20/SR22. The test requires the task “Instrument Approach without Primary Flight Display”, which has taken the place of what was the partial panel approach, accomplished without use of gyroscopic heading and attitude indicators. In the Cirrus, the standby attitude indicator, standby airspeed, and standby altimeter are available, as is the Multi-Function Display. Guidance from the FAA has us shooting a GPS approach using the moving map display on the MFD after disabling the PFD. Those of us who trained and tested in steam gauge aircraft think that this task should be fairly easy. With a fully functional Attitude Indicator and a nice big moving map display showing our course, a reasonably competent instrument pilot should have little trouble adapting to this setup and flying a good approach.

    But, in the Cirrus specifically, and perhaps in other aircraft as well, another question comes up. Can the applicant use the autopilot (which still works just fine after a display failure) during the approach without the PFD? A rather famous DPE who writes for a national magazine says “yes”, opining that not to allow its use would be introducing simultaneous multiple systems failures, which is strictly forbidden in the minds of some. If we follow this logic, we would not test simulated engine failure emergencies in these aircraft either, because to do so would imply failure of not only the engine, but the CAPS parachute system as well. In my former role as a pilot examiner, I always said no, that the approach should be hand flown. Here is my logic.

    I was amazed that flight instructors and examiners would accept the substitution of autopilot technology for the skill required to fly an approach without the PFD. I would argue that the intent and the well described emphasis of the PTS is that the applicant must demonstrate the ability to control the airplane after a loss of the primary flight display, not observe and monitor the autopilot controlling the airplane! This argument was generally unpersuasive, so I approached from a different point of view, that of a concerned family member.

    “Aunt Betty” represents a future passenger flying with the soon to be rated instrument pilot. Here is the question posed to Aunt Betty: “When we train and test pilots for instrument proficiency, we require them to demonstrate the ability to safely and skillfully fly the airplane without their primary instruments. Now, Betty, in this airplane, we can test this task in one of two ways. We would like your input on which way you would prefer, seeing as you will be a frequent passenger with your nephew. We can either have the pilot (might be your son, brother, husband, or nephew) demonstrate that he can fly the airplane by hand without the PFD, which does require a little more skill and a slightly different technique, or, we can require the pilot to perform this task using the autopilot so that the pilot basically monitors the airplane flying itself on the approach.

    “Now, Aunt Betty, a pilot allowed to use the autopilot system on this approach may not have the skill or technique to fly the approach by hand in the clouds should the autopilot shut down due to turbulence or mechanical failure. Should this happen to a pilot without the skill and practice normally required, the odds of a fatal accident occurring would be quite high.

    “So what do you think, Aunt Betty? Would you feel more comfortable flying with this fellow if he has demonstrated mastery of the aircraft (sans PFD) without the autopilot or only with its assistance?”

    This leads us to a larger discussion about the use of other technology, iPad, GPS moving map, and more. If technology is used as a replacement for pilot proficiency during training and testing, we end up with less skillful, less competent and ultimately less safe pilots. But, if we require that our students demonstrate mastery with the lowest available level of automation and technology (which, by the way, implies excellent fundamental aircraft control skills) then, when technology is added into the equation, we have a safer pilot.

    Technology can be a value added safety multiplier, or it can be a crutch needed to make up for lack of fundamental and advanced skills. Crutch or Safety Multiplier, which one will you choose? I know which one Aunt Betty prefers.

    Charles McDougal is a flight instructor, corporate pilot, and former DPE ‎who offers basic and advanced flight instruction in the San Antonio area.  To find out more information about Charles or to contact him, visit his website, www.flighttrainingcoalition.com.

  • Garmin GFC 600 Autopilot Certified for the Piper Meridian

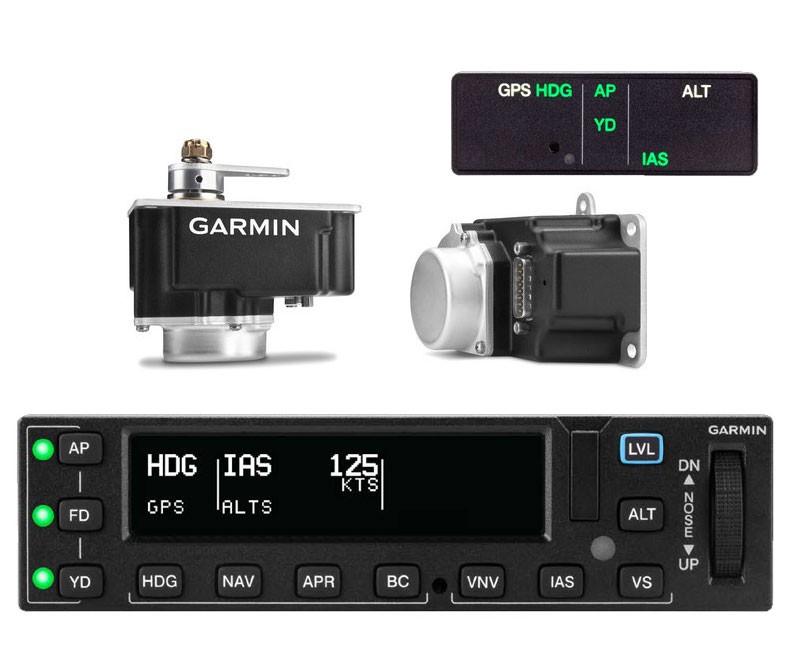
    In the fall of 2021, Garmin announced the long awaited confirmation that the Garmin GFC 600 autopilot is now certified for the Piper Meridian. The Garmin GFC 600 autopilot has been certified for all other types of the Piper PA46 line of aircraft, but the Meridian was last in line. The airplane has to have been manufactured prior to 2009 and have Avidyne avionics, Meggitt, or have been retrofitted with a Garmin G500 (no G1000 aircraft since those already have the GFC 700 autopilot).

    The Garmin GFC 600 autopilot is the ultimate digital autopilot. The integration with the Garmin G500, GTN 750 and GTN 650 units is a beautiful thing. The autopilot communicates with all the heading and altitude bugs, flies approaches smoothly, and even has a level button.

    In the latest technological marvel from Garmin, Garmin Safe Glide, the GFC 600 autopilot is critical in reducing pilot workload in an engine failure situation. It flies the airplane for you and takes you to the nearest airport, reducing the stress and allowing the pilot to troubleshoot the situation.

    Texas Top Aviation recommends Abilene Aero in Abilene, Texas for any and all avionics installs. They have worked with several of our customers in the last year, are extremely knowledgable and do excellent work. Call them for a quote on a new Garmin GFC 600 autopilot in your Piper Meridian.

  • Icon A5 Thought to Have Crashed in California


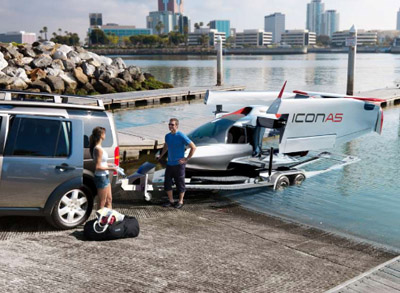
    Most pilots have seen the Icon A5 light sport amphibious aircraft.  It’s a neat design that can land on water or on a runway.  The high wing design with a pusher prop has foldable wings that allow it to be put on a trailer and towed behind a vehicle, allowing it to be offloaded at boat ramps (it also begs the question can you wakeboard behind it?).

    Apparently, not all non-pilots know about the Icon A5.  Last week, one landed in the water near a beach in Southern California, but most of the beach goers and local authorities believed it had crash landed in the water.  Emergency crews were dispatched, but everyone was surprised when the two occupants crawled out on the wings, had a cup of coffee, and took back off.

    You can read the full article on the Flying Magazine’s website.

Leave a Reply

Your email address will not be published. Required fields are marked *