One of the first questions a student pilot asks me when starting the cross country portion of his or her training is, how do I know what altitude is best for my flight? This is a good question, because without taking certain aspects of the flight into account, it’s really just a crap shoot when selecting an altitude. Craps and flying don’t mix, so let’s take a look at a few considerations when selecting an altitude.
Sky Coverage
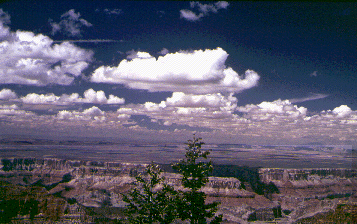
Sky coverage has several subcategories when it comes to selecting an altitude. First is how high are the bases? Is it IFR (VFR pilots would be grounded), marginal VFR (1,000 AGL to 3,000 AGL ceiling), or good VFR (above 3,000 AGL ceiling)? If the cloud deck is only 2,500 feet off the ground, then VFR pilots are limited to either 1,000 AGL to 2,000 AGL. This is an excellent segue into why VFR pilots shouldn’t scud run!
Second, what kind of cloud deck is it? Is it an actual ceiling (broken or overcast), or is it a scattered layer? Few or scattered layers usually allow VFR pilots to find a hole to get higher to some smoother air, making the flight more pleasant. VFR pilots, always make sure to check the destination weather as it could be scattered where you are departing from, but it might be broken or overcast where you are arriving.
Last, how high are the tops of the clouds? Pilots can only get this information in the planning stage from the area forecast or from pilot reports, so most of the time, it’s not very precise information. If the tops are at 10,000 feet and the pilot is flying a 172 on a 30 mile trip, it doesn’t make much sense to get on top of the clouds.
Terrain and Obstacles
Terrain goes hand in hand with sky coverage. If there are low clouds and high terrain, that doesn’t bode well for trying to stay VFR and not hitting anything. Obstacles need to be taken into account too, as there are some pretty tall radio towers that can stretch up into a 1,500-2,000 AGL deck of clouds.
Winds Aloft
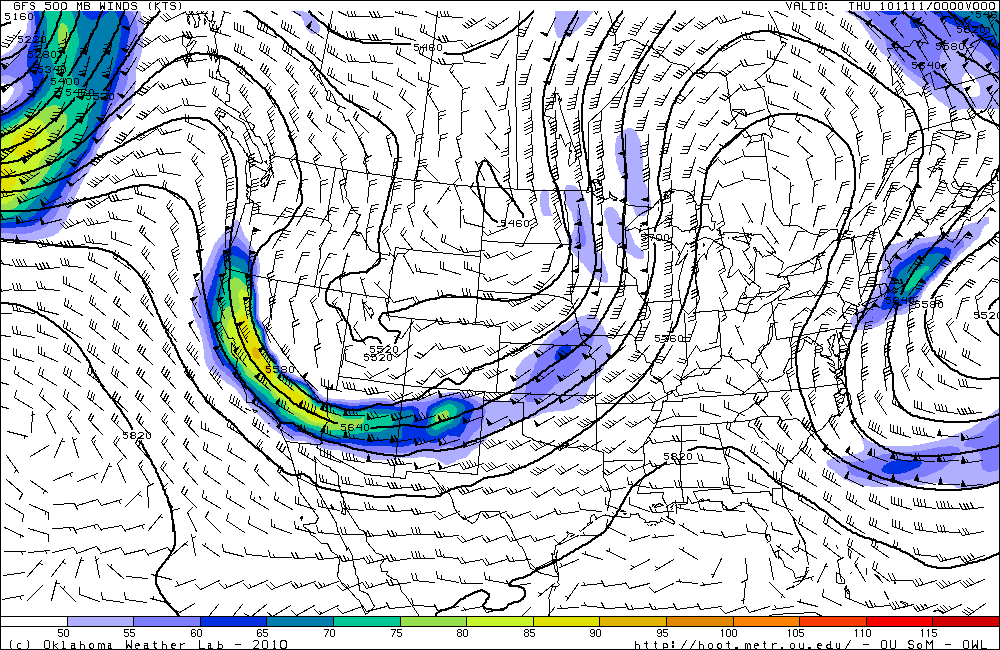
Once the sky coverage and terrain have been considered, it’s time to look at the winds aloft. Tailwinds are preferred, but, sometimes, a headwind is the only option. After taking the clouds and terrain into account, this narrows down your altitude to a handful of options. The winds aloft will further narrow it down.
Aircraft Performance
Once you have two or three altitudes in mind, taking a look at the performance charts for your airplane will help nail down that final altitude. Pull out the POH, compare fuel burn and cruise speed, and you’ll have your altitude selected.
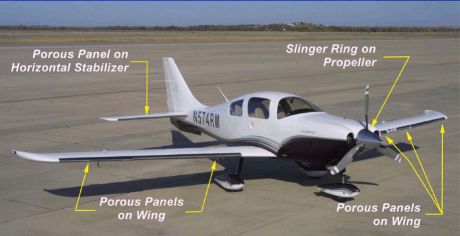
When cleaning airplanes, the majority of people don’t know how to properly maintain their TKS panels. TKS panels provide wing leading edge, horizontal stabilizer leading edge, and, in the case of FIKI airplanes, vertical stabilizer leading edge de-icing protection. For those not familiar with them, they are metal strips that have thousands of holes drilled into them where the TKS fluid seeps out. They have become quite prevalent on Cirrus aircraft, the Cessna TTx, and Mooney aircraft manufactured in the last decade or so. The system is also known as a weeping wing system.
Being on the leading edges, these panels pick up bugs very easily. For the uninitiated, it would make sense to just use normal airplane cleaner to spray the panels and scrub the bugs. Don’t!
Using anything that contains Methyl Ethyl Ketone (MEK) as that can harm the TKS bladders behind the panels. Any aircraft cleaner containing wax could cause the pores to clog, preventing the TKS fluid from properly seeping onto the wing.
What’s the best thing to do? Soap and water with a soft cloth is a good start (again, make sure it doesn’t have wax in it. Dish soap would be suitable). No hose available? Just simply turn the TKS system on, let it run till you start to see fluid drip off the wings onto the ground, and use the fluid to clean the panels.
A soft cloth would work fine, but, if the panels are really buggy, take a green scouring pad to do some scrubbing. Just make sure the scrubbing motion is up and down with the grain, not side to side. You can find the green scouring sponges on the dishwashing aisle in the grocery store. Just leave one in the hangar for when you need it.
When cleaning airplanes, the majority of people don’t know how to properly maintain their TKS panels. TKS panels provide wing leading edge, horizontal stabilizer leading edge, and, in the case of FIKI airplanes, vertical stabilizer leading edge de-icing protection. For those not familiar with them, they are metal strips that have thousands of holes drilled…
Many people ask, which set of charts is better? Should I use the FAA Aeroservices charts on Foreflight or pay extra for the Jeppesen charts? Since you have to pay for Jeppesen, they are probably better, right?
I am not here to say which one is better as a chart preference is just that, a preference for one over the other or for certain features. After a while, muscle memory and routine take over and you probably wont even notice the difference.
History
In 1934, Elroy Jeppesen began making his own charts and sold them to other pilots. His little company grew into the giant Boeing chart company we know today. Jeppesen charts are used internationally and therefore include information that might otherwise seem common knowledge, like transition altitudes. The key is, you cannot get FAA Aeroservices charts for international destinations. Jeppesen is the only option for outside the US.
National Aerospace Charting Office (NACO), or the new(er) name “Aeroservices” or FAA chart, whatever you decide to call them, are United States government issued charts. In addition to civilian use, Aeroservices charts are used by the military so there will be some terminology that does not apply to civilians. The best part about FAA Aeroservices charts are… they’re free!
If you are in the middle of a transition or trying to decide which charts to use, you have come to the right place. Here are a few key differences.
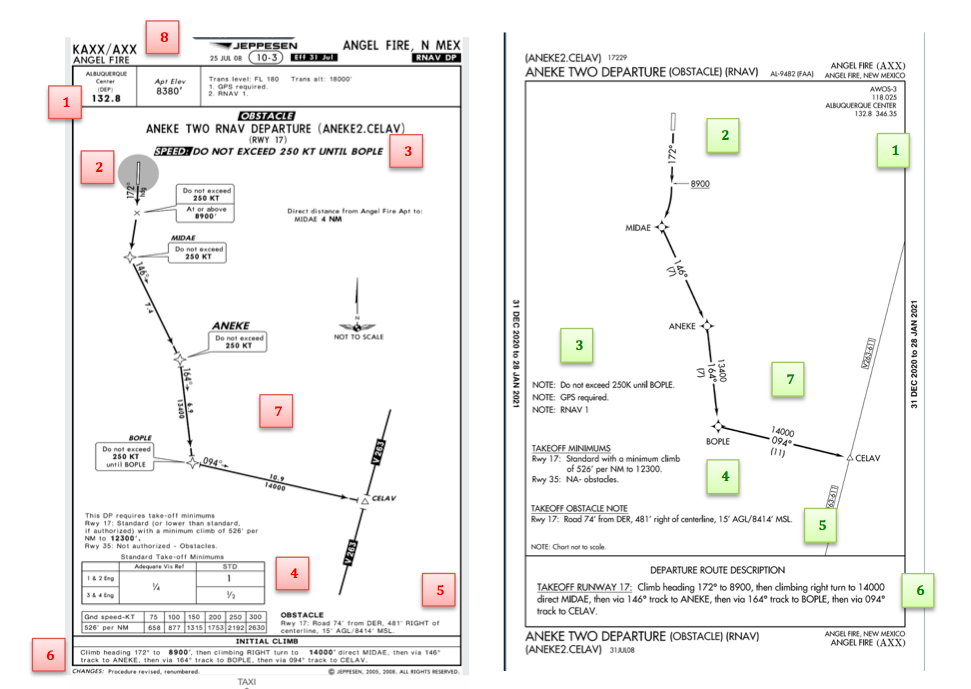
Obstacle Departure Procedure Chart KAXX (Angel Fire, New Mexico) ODP
Frequencies: FAA Chart provides the AWOS so you have all departure frequencies in once place.
Airport: Jeppesen highlight the airport, which is a nice feature so you can easily see the flow from the airport.
Notes and Remarks: Jeppesen bolds the speed restriction all over the chart so you won’t miss it. All other requirements are in the top right corner. Note the transition altitude 18,000′. Since Jeppesen is used internationally, it is published on the chart since other countries have different transition altitudes. It takes up a chunk of chart real estate, but it’s clear, easy to read, and always in the same place. The FAA charts post all the requirements and restrictions as notes off to the side. Since it’s in the same space as the chart graphic, it’s easy for the eyes to catch while studying the plate.
Take off Minimums: NOT APPLICABLE for PART 91 – however, it’s wise for all pilots to look and abide by them. Jeppesen displays the standard take off minimums table, as well as the rate of climb table, which is nice to have all in one place. The FAA chart gives the non standard information but you need to know/look up the rest in the Digital Terminal Procedures Supplemental document. (Hint: It’s in the Documents section of Foreflight)
Take Off Obstacles: About the same on both charts
Route Description: Similar on both charts, but larger font and clearer description on the FAA chart. When there are different routes from different runways, the FAA chart layout is really helpful.
Graphic Layout: Jeppesen and FAA use the same graphics for all their different charts and plates which makes it easy to read once you are familiar with the respective charts. FAA charts are easy to read and distractions are kept to a minimum. Jeppesen charts make things bold and enlarge pertinent information so you won’t miss it.
Airport altitude: This is only on the Jeppesen chart (the FAA chart doesn’t include it), but it is very helpful for situational awareness. As you brief the arrival altitudes, I think it’s important to have an idea what AGL you are at.
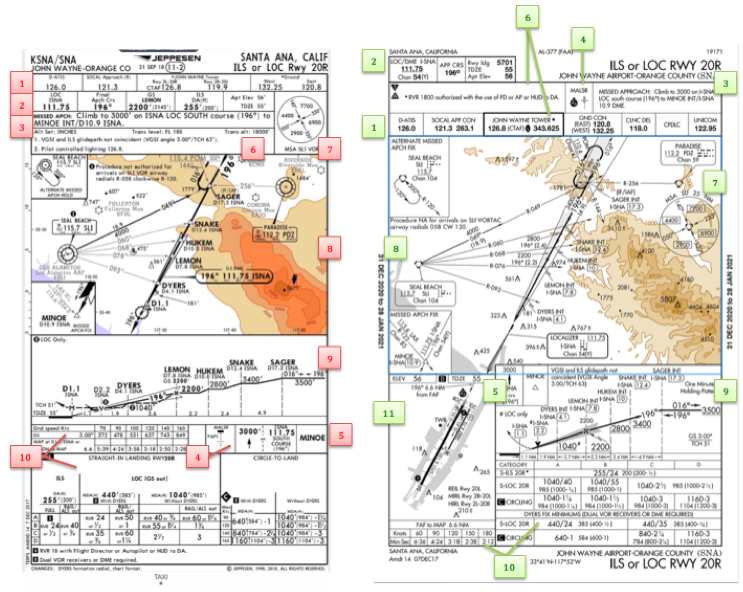
Approach Charts
One thing pilots love about Jeppesen approach charts is the clear set up for an approach brief. The top section is created as a “briefing strip” starting with the frequencies, then navigation frequencies, minimums, airport elevation and the missed approach. It’s very natural and user friendly.
FAA charts have a slightly bigger picture of the approach planview, but the profile view and minimums section can get a bit cluttered. It can feel a little discontinuous when briefing the approach to bounce all over the page. However, some pilots really like the small airport diagram in the corner, which I find really helpful for situational awareness (particularly for students learning circle approaches). Non- standard alternate and takeoff minimums are also clearly noted, but unfortunately we must hunt elsewhere to find them. The Jeppesen alternate minimums and takeoff minimums will both be on the airport diagram
Frequencies: Getting weather and tuning radios is easy on the Jeppesen charts – just follow the briefing strip. The frequency section on the FAA charts is still easy to read, but closer to the center of the page. It’s split up from the nav frequencies and other important briefing information. a. FAA charts are created by the government and have military specific information, which are the odd looking frequencies and channels on the chart.
Approach Navigation: On a Jeppesen chart, you will continue to the next line to verify your frequency, course and set minimums (assuming you are straight in on the ILS). On the FAA chart, you will then have to skip to the top of the chart to get the frequency and course, and then scan to the bottom of the page to input your minimums. However, since you could be flying a localizer approach or a circle to land, it’s a good reminder that not everyone using this approach chart will be using the same Decision Altitude (DA). The FAA chart also includes runway distance information so pilots can make determinations of approach speeds and stopping distance if the runway is wet or icy.
Missed Approach – Textual
Approach Lighting
Missed Approach- Graphical: The missed approach information is the same on both charts. The lighting information is key for determining a missed approach and is next to the missed approach text on the FAA chart. It’s found next to the missed approach graphic on the Jeppesen chart. Personally, I find it easier to find and read the lighting information on the Jeppesen chart. Remember, on both charts, the placement of the PAPI on the chart indicates the physical location of the lights (left or right of the runway).
Notes: Both charts have a notes box, but they use them a little differently. Once again, remember that Jeppesen charts are used internationally and include the transition altitudes and altimeter setting info. On both charts, the notes section will be where other critical information will be shared which isn’t really applicable for this airport. On the FAA chart, the tower frequency is starred to note that there are operating hours (you’ll have to check the chart supplement AF/D to find out what those hours are). There is also an L next to the frequency to indicate it is the pilot controlled lighting frequency. You will also find the note about the VGSI and the Approach Glide path next to the profile view on the FAA chart, whereas the Jeppesen chart has that note in the notes section at the top. The FAA chart also has the T and an A in black triangles to note that this airport has non- standard alternate and take off minimums. Again, those are found in separate documents when using FAA charts and on the Airport Diagram when using Jeppesen charts.
Minimum Sector Altitude: Similar on both charts, but in different locations (reminder: ATC vector altitudes may be lower. It is the pilot’s responsibility for safety of flight to maintain safe obstacle clearance, so if you are ever concerned about going below the MSA – just ask ATC).
Planview: Other then differences in size, visuals, and text, the information displayed on both is very similar.
Profile View: Again, the displays look different and pilots will have their preference, but the information is the same.
Minimums: Jeppesen charts not only note the category for each approach with its designated letter, but also displays it in knots. It is recommended that if you increase your approach speed (based on flaps or gusty winds or perhaps a faster speed for a circle to land approach) that you should use the higher category minimums. The reference guide makes that easy to look up. The other benefit of the Jeppesen charts is right the table that contains the time from the final approach fix to the missed approach point for a localizer approach, it also shows the rate of descent with the associated ground speed to maintain a 3 degree glideslope. Now there is no excuse not to set pitch and power! The minimums posted in parenthesis are for the military, but RVR in statute miles is also included.
Airport diagram: Only on the FAA charts, this particular feature is particularly useful for situational awareness. The arrow pointing to the runway shows the direction the approach is arriving from so planning a circle to land is a cinch. There is also a lot of other information that can be gathered from the airport diagram for quick reference or to help a disoriented pilot: lighting, displaced thresholds, closed taxiways, and runway placement and lengths. This is easily one of the best perks of an FAA chart.
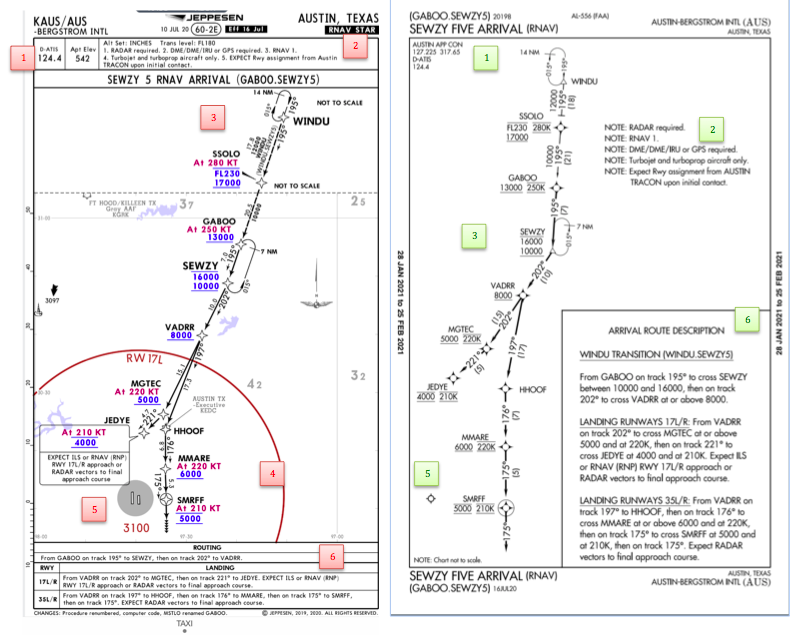
Arrival/ Departure Charts: Sewzy 5 Arrival KAUS
The Jeppesen lay out is very attractive and draws the pilots eye in a clear way to all the important information. The colors pop out, so the required altitudes and speeds are easy to read and remember. The chart, which is the proper scale, shows MORAs , easy to find airports (and runway layouts) and is over all easy to follow. However, the texts, while very clearly laid out, are small and difficult to read and pushed to the very edges of the chart. FAA charts are simple and fairly easy to read, but the airports are not as obvious and the flow to the airport requires a good look. The table on the Jeppesen chart is a really nice format, but the text and Notes for arrivals on the FAA chart are easy to find and much easier to read quickly.
Frequency: FAA charts include the approach frequency on the arrival, which is helpful for having radios tuned. During a busy time when the controller changes your frequency, all you have to do is verify the frequency you already set, rather then totally stop what you’re doing to switch it. The Jeppesen charts add the airport elevation next to the ATIS, which really aids situational awareness.
Notes: Jeppesen notes are clearly numbered and tucked away nicely in a box, but the FAA chart notes pop out in the middle of the page and are easy to skim for pertinent information.
Planview: I think Jeppesen is the clear winner here- it is so easy to read, it only takes one glance to know where the primary airport is and how the arrival flows. The chart being at the proper scale offers the pilot important geographical information and over all is a clean look. Notice the small series of arrows after SMRFF on the the Jeppesen chart; those indicate the pilot should expect radar vectors. The FAA charts include those instructions in the text, but I find the visual reference on the chart helpful. The FAA charts are equally clean, with altitude and speed restrictions easy to read even if they don’t jump out. When there are multiple airports that the arrival serves, the airports are clearly marked, though, I think it would be nice to have a little more information surrounding the primary airport for better situational awareness.
MSA: only on the Jeppesen chart
Primary airport: The runway alignment and grey highlight on the Jeppesen chart stands out very clearly, while the FAA airports are a little more obscure.
Arrival route description: The table on the Jeppesen chart is easy to follow but the text is very small and pushed to the bottom. The route description is much easier to find and read on the FAA chart.
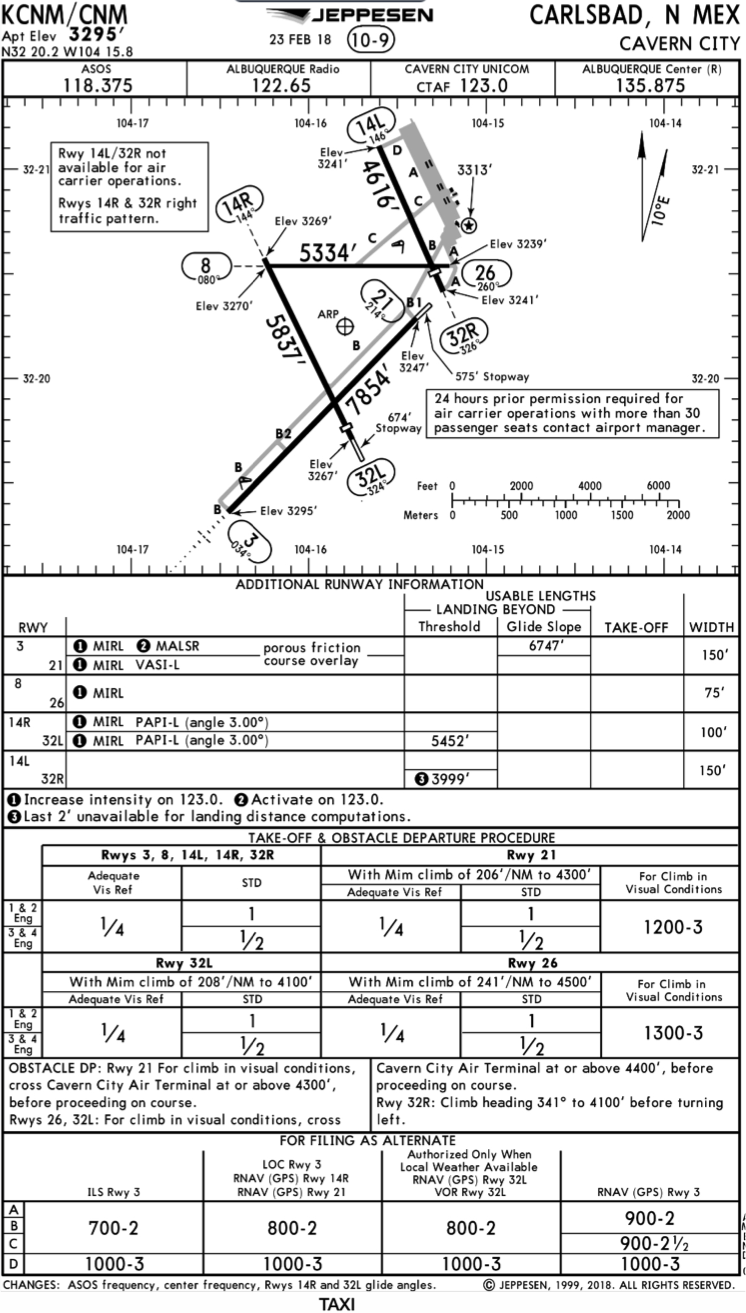
Airport Diagram
The Jeppesen Airport Diagram page has it all: frequencies, airport diagram, runway info, take-off minimums, departure procedures and alternate minimums. It’s a one-stop shop. It makes preflight planning easy when its all at your fingertips.
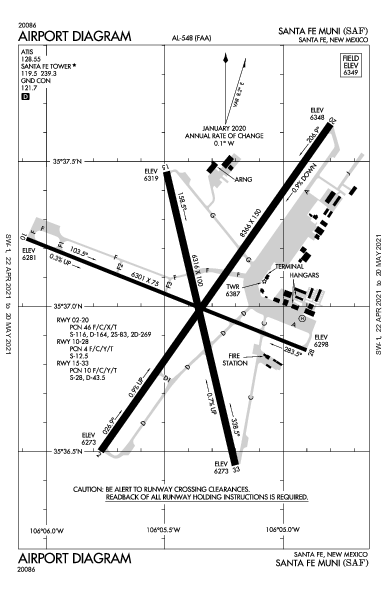
The FAA charts usually require a little more searching for different pieces of airport information. The Airport Diagram itself is just the airport layout. Above, you will see a simple FAA Airport diagram. It’s clean and simple, perfect for a knee board print out.
In the flight planning process, as you look at what approaches you will be using for the airport, you might see an A or T inside a triangle. Those indicate that you will need to look in the Alternate Minimum or Take off minimum documents for more information. The Takeoff Minimums document (see below) is also where you will find any obstacle departure procedures for that airport. Apps like Foreflight help you out by posting the take off minimums under the departure tab. Even though it’s a little more difficult to read, I didn’t crop out the airport information so you can see what it looks like in context.
FAA Alternate Minimums on the Left and Takeoff Minimums and Obstacle Departure Procedures on the Right
Many people ask, which set of charts is better? Should I use the FAA Aeroservices charts on Foreflight or pay extra for the Jeppesen charts? Since you have to pay for Jeppesen, they are probably better, right? I am not here to say which one is better as a chart preference is just that, a…
I got the privilege of going to the EAA AirVenture at Osh Kosh this year. It was my first Osh Kosh experience. I’ll be the first to tell you, walking in the gate on the first day is mildly overwhelming. There are people and stuff everywhere. Airplanes, tents selling everything from airplane parts to mattresses (I wasn’t really sure how mattresses tied to flying), vendors, colleges, and loads of people.
Photo Courtesy of William Day, copyright 2018, All Rights Reserved
After I gathered myself from my initial shock, I set out to explore all that I could. I spent most of the first morning walking around the different manufacturer’s tents, getting a gauge on all the new airplanes I could never afford and only hope to ever fly.
The short of it is, the Cessna/Textron Denali is going to be stellar once it gets completed. The Epic E1000 (if it ever gets certified) might take a large market share from TBM, though they will have an uphill climb. The Cirrus Vision Jet is very cool and should be a relatively simple step up for SR22T owners. The Pilatus Jet is huge. Finally, the Diamond DA62 would be my below 12,500 airplane and the Piper M350 would be my pressurized plane. Money being no factor, of course.
Photo Courtesy of William Day, copyright 2018, All Rights Reserved
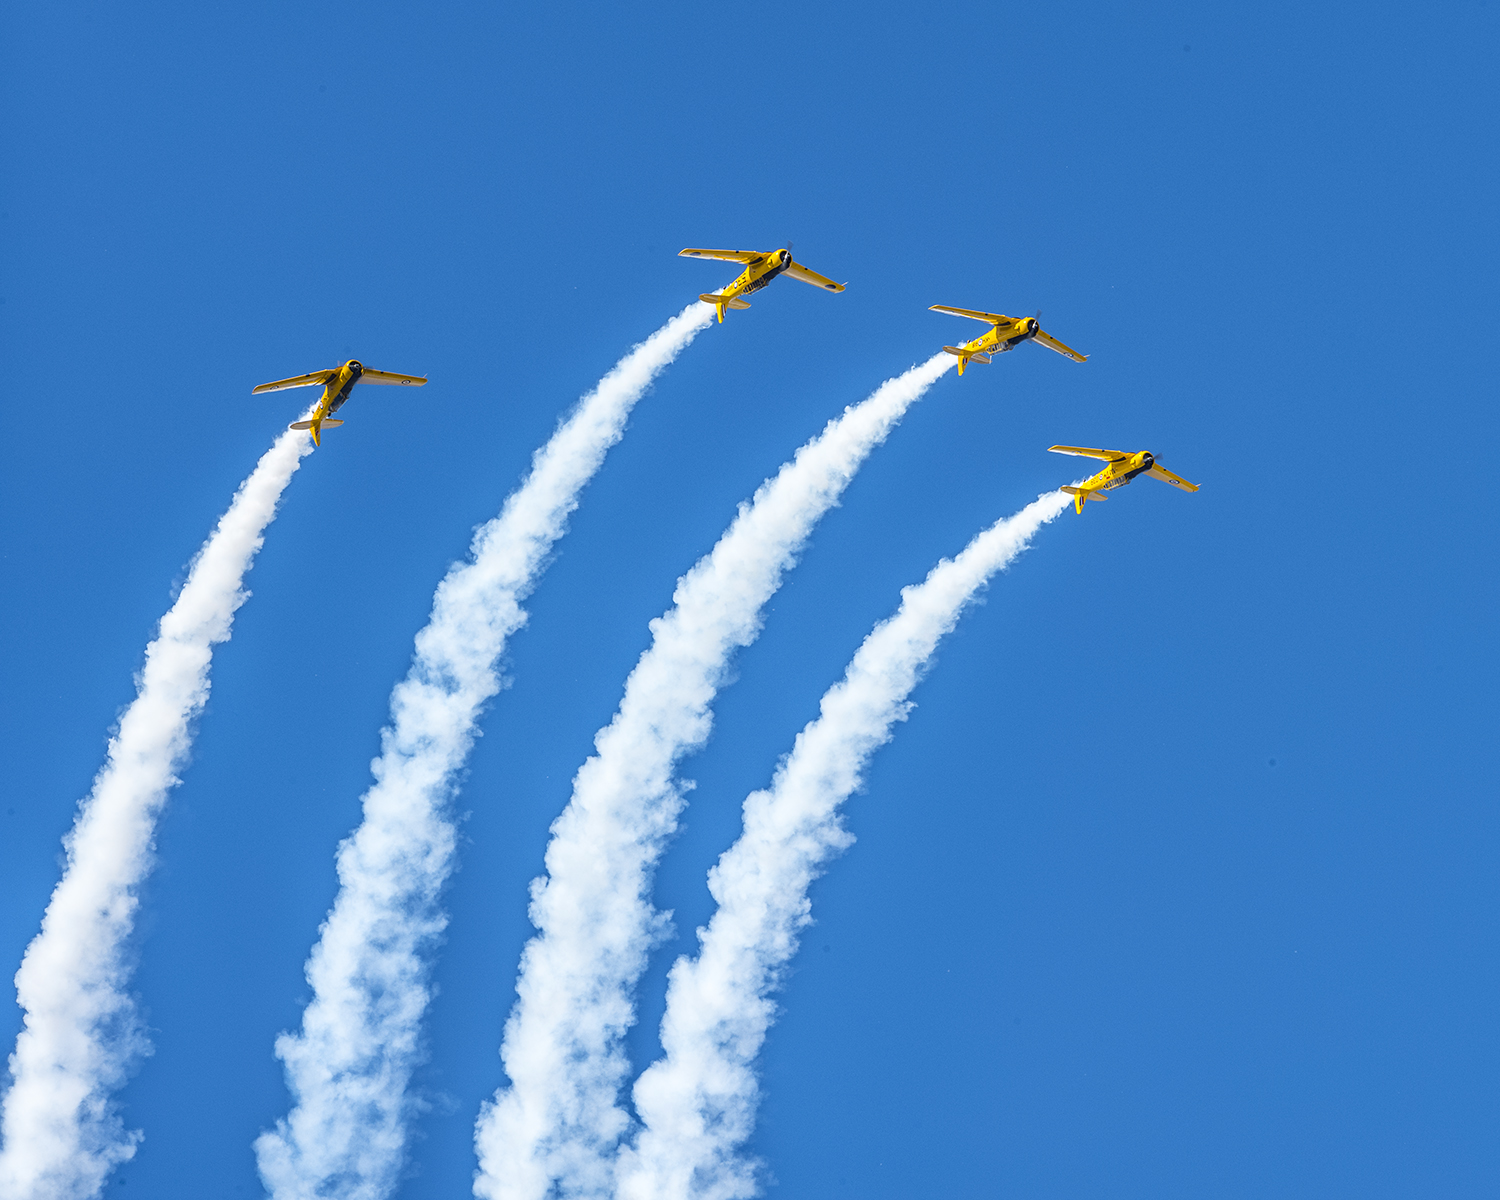
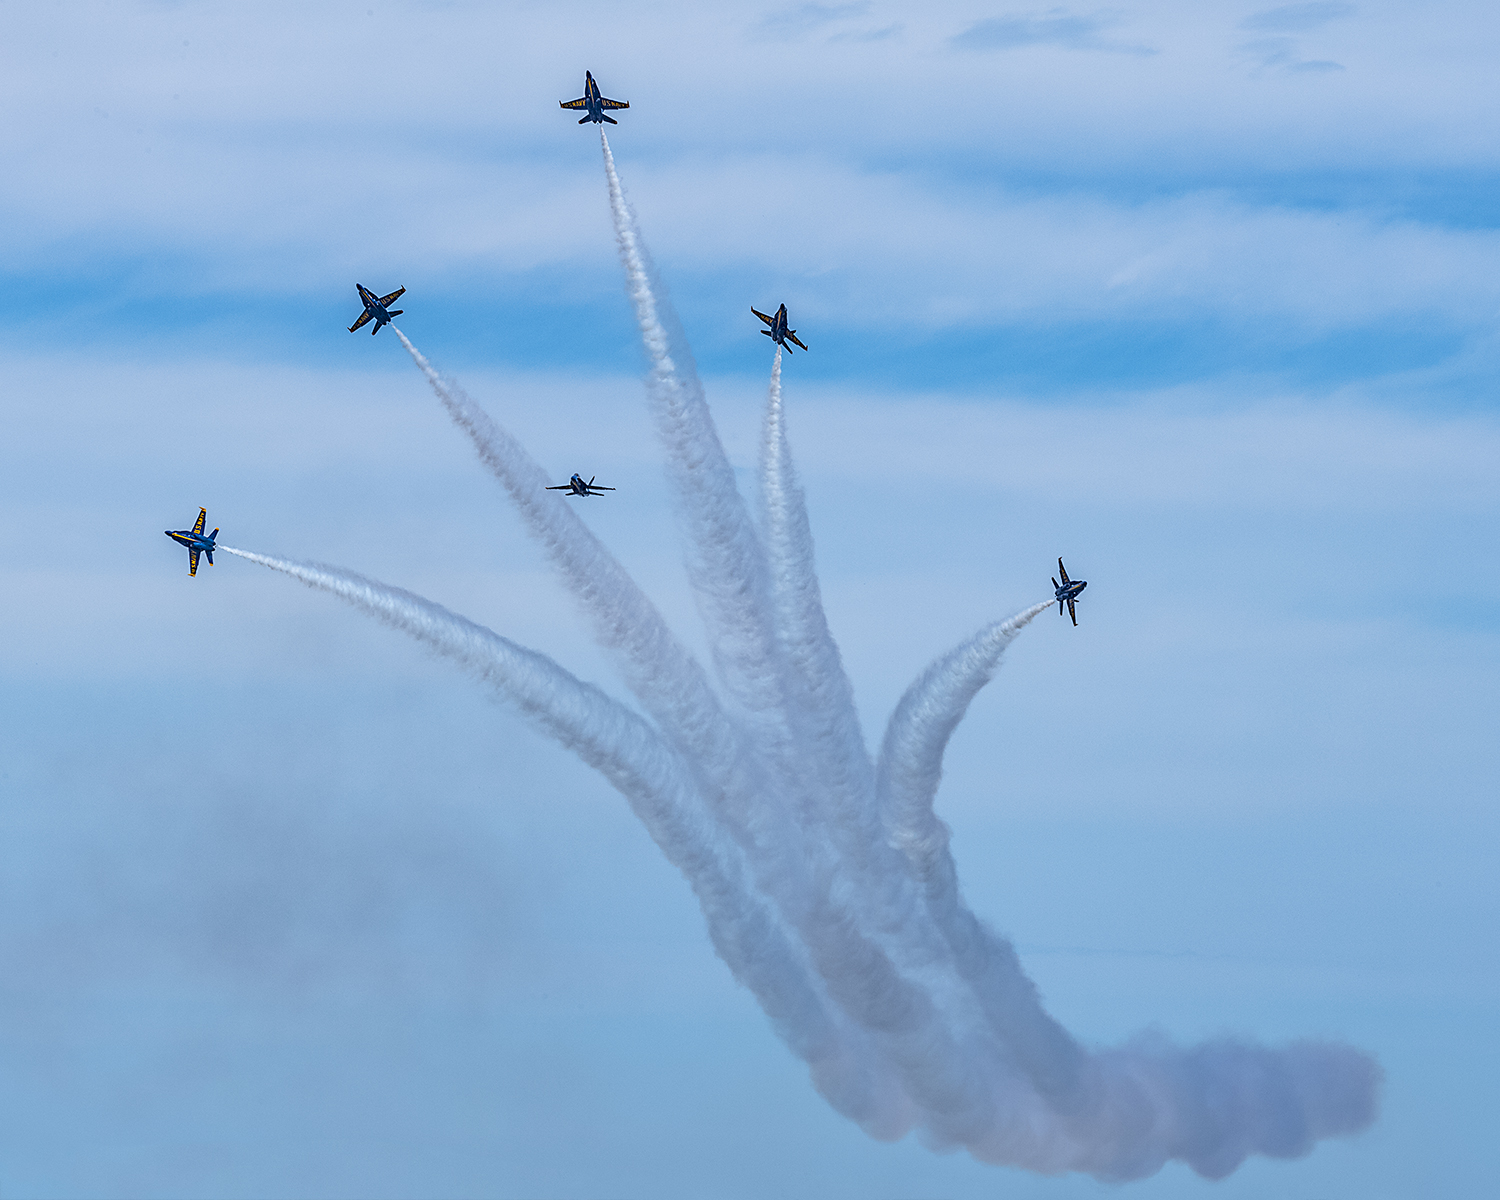
I decided to take in the entire airshow on Day 1, all 4 hours of it. Upon realizing I would be very stiff necked if I did that each day for the three days I was there, I decided on Day 2 to check out some seminars and learn something. I took a seaplane ground school course on Day 2, then listened to a NASA presentation on electric airplanes and low boom sonic jet technology (how to make supersonic passenger flight quieter).
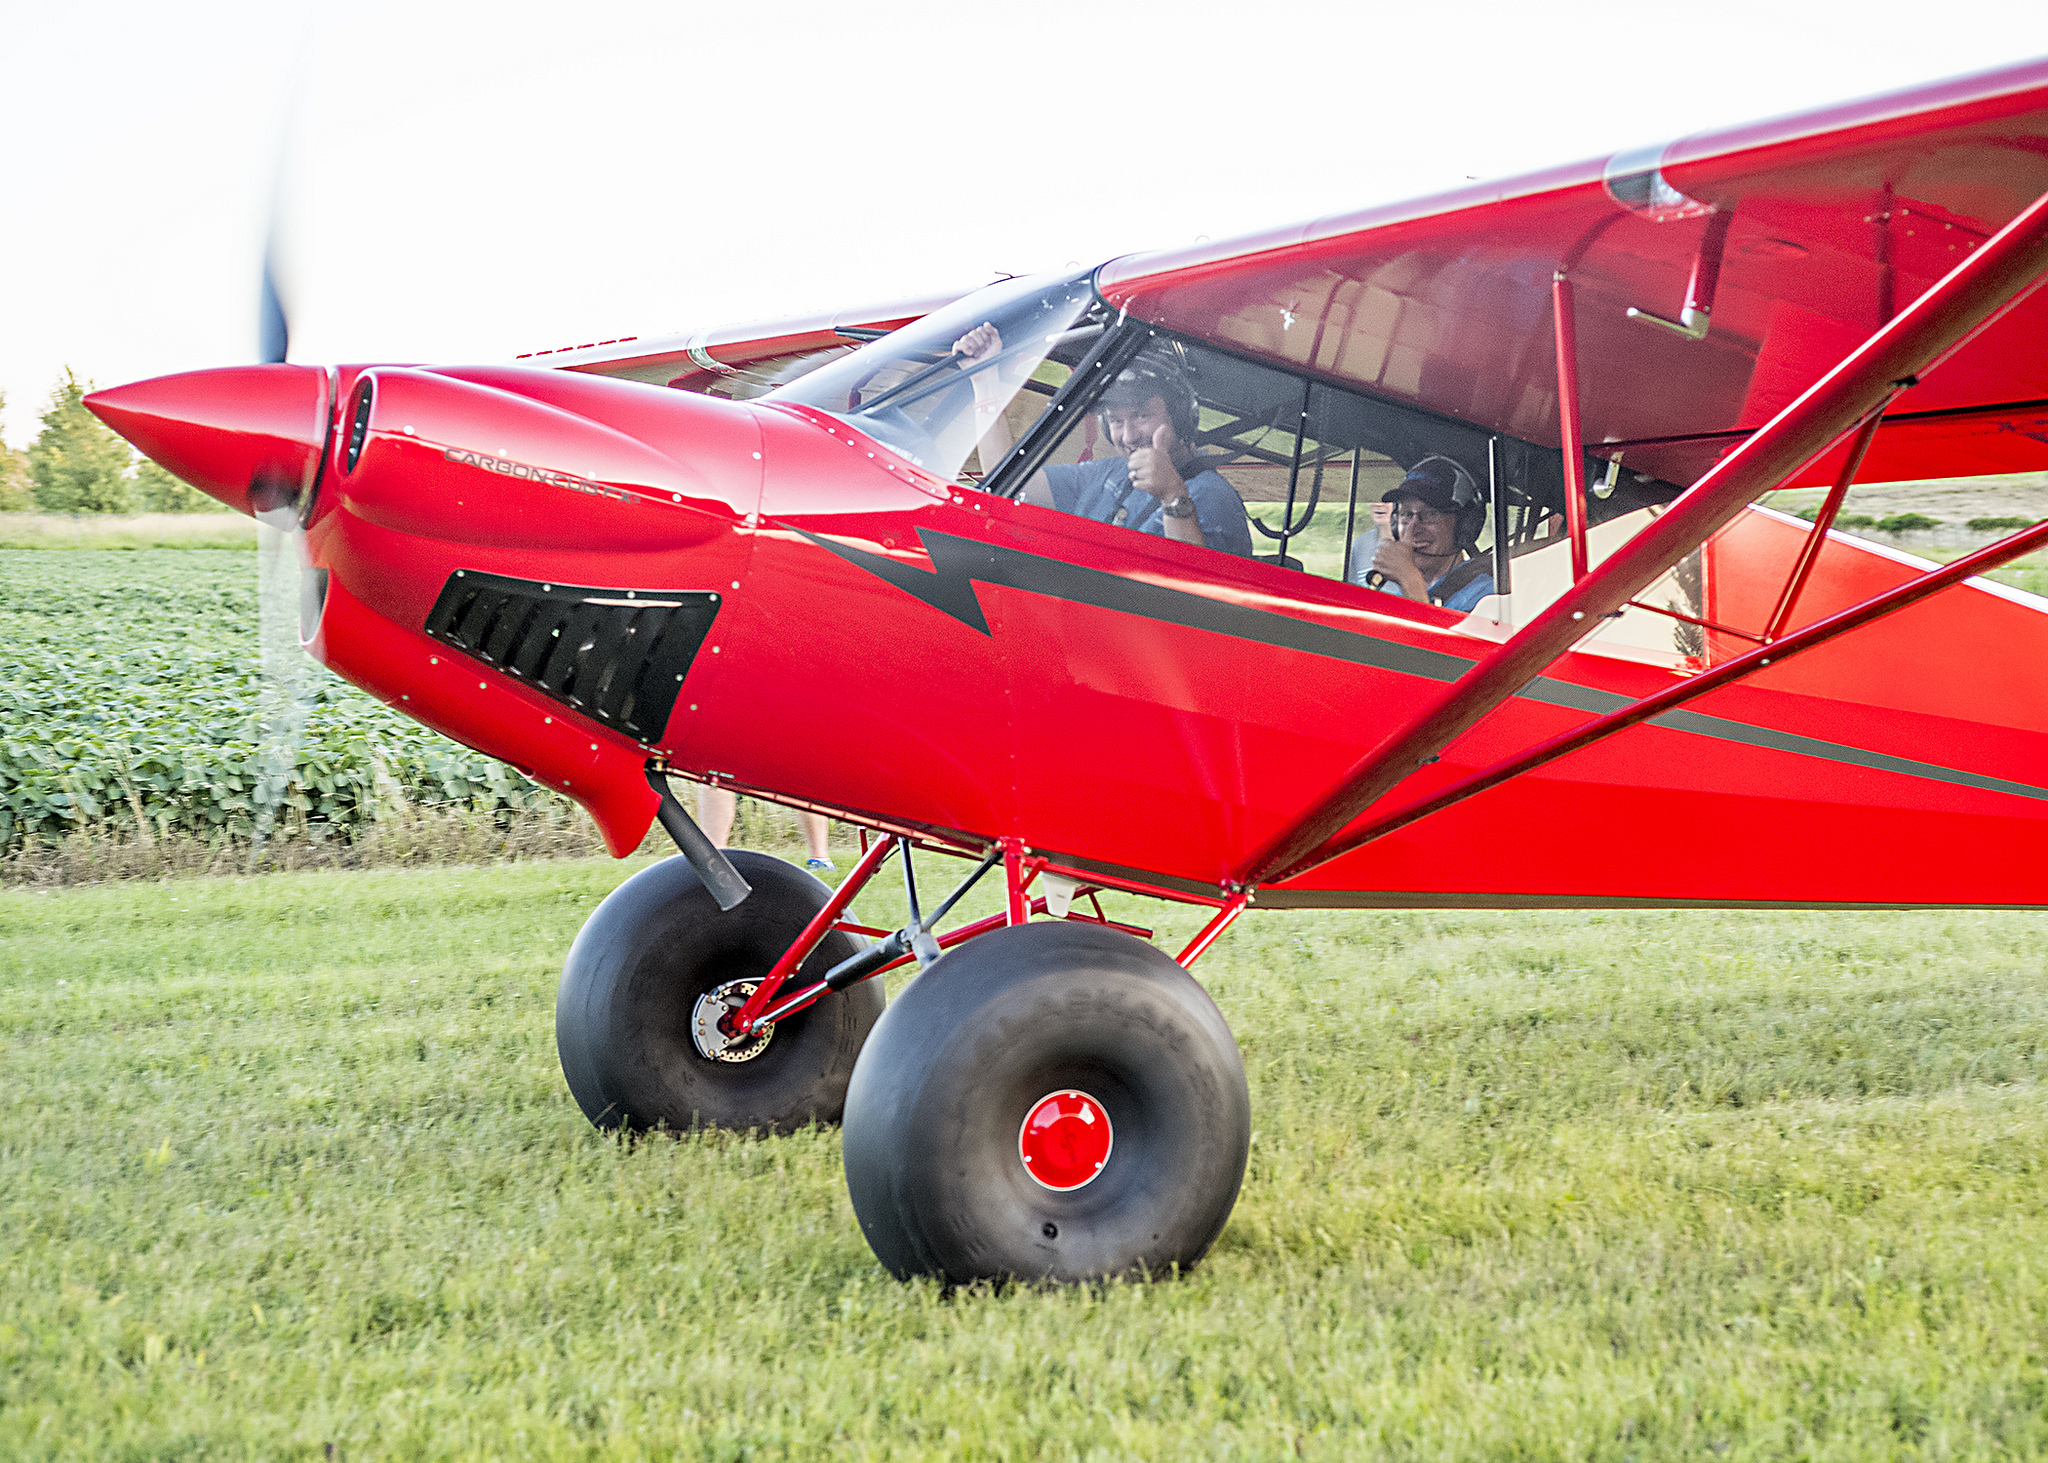
The end of Day 2 at Osh Kosh had to be the highlight. I got to hang out with Cub Crafters at the 51WI grass strip just north of the OSH Class D airspace. There was a free BBQ and I got to take a ride in a Carbon Cub. My landing from the back seat was a bit rusty, but still a very cool experience. Buzzing the BBQ area in tandem was pretty neat.
Photo Courtesy of William Day, copyright 2018, All Rights Reserved
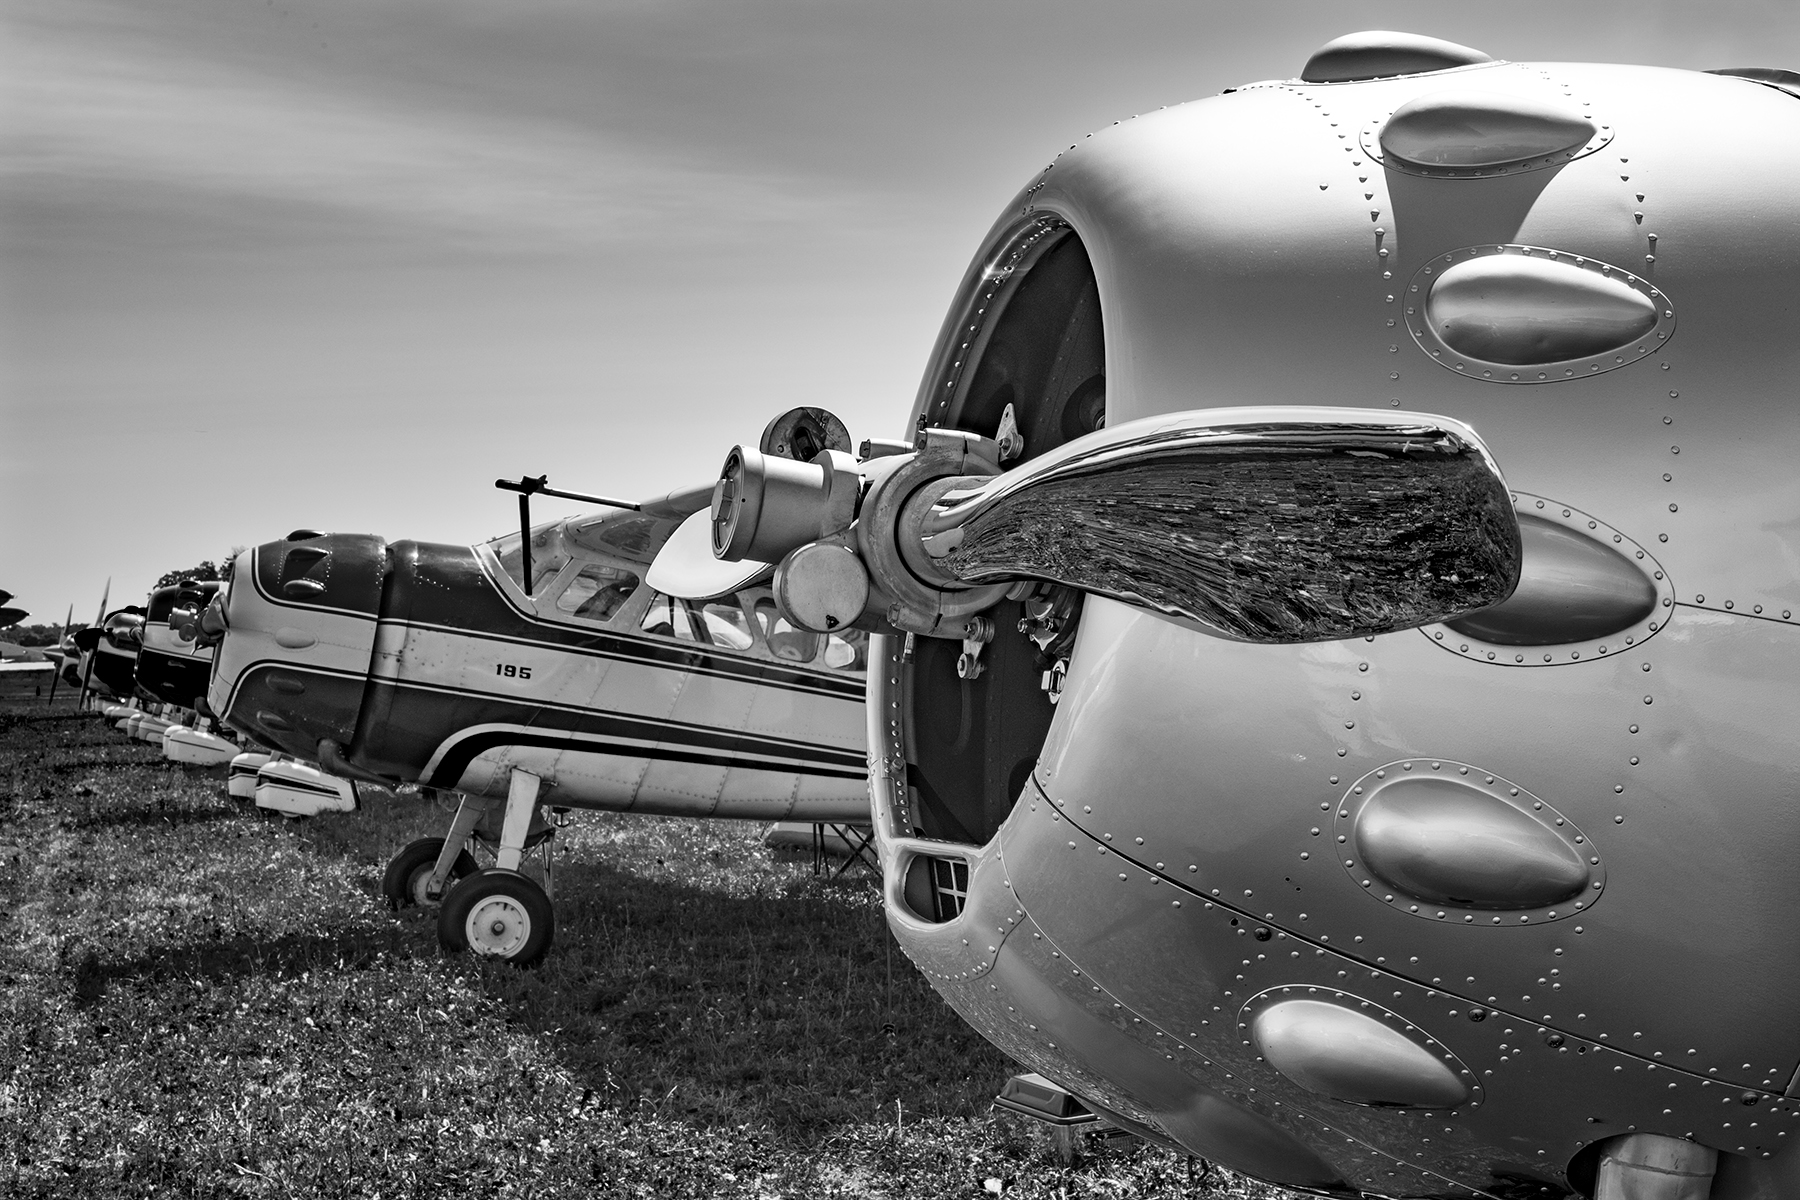
Day 3 brought some cooler temps and some clouds. We walked out to the vintage airplanes, spending the morning gawking at Cessna 195s and Wacos. Then I took the plunge to explore all the vendor hangars. My idea was to walk around and see if I can find some interesting and innovative technology. Well, after 2 of the 4 hangars, my head was spinning, so I decided to watch the rest of the airshow to let my brain drain out a bit.
Photo Courtesy of William Day, copyright 2018, All Rights Reserved
3 Days was a good amount of time to spend. I don’t think I could have stayed all week, but only a day or two wouldn’t have been worth it. I flew up with a former student in his TBM 700, which was a very nice way to travel. We landed and stayed in Green Bay (KGRB), which was super easy and low stress. Had a great tailwind on the return and made it to Houston non-stop.
A few closing observations:
The Stratos 716X Personal Jet
If Stratos Aircraft is ever able to bring this to market, it sounds awesome. 400 knots, single engine, single pilot, with 6 seats. Being a single engine jet, similar to the Cirrus Vision Jet, it’s 100 knots faster, plus with the airflow and engine technology, it doesn’t have that big V Tail in the back, thereby reducing drag. I have a feeling it would find a good market, but the certification process is a bear to get through. Just ask Epic.
The Lancair Mako
This is a legit airplane. Lots of thought was put in to the design of the Mako by the new Lancair organization in Uvalde, TX (KUVA). The airplane was extremely comfortable, capable, and pretty cool. The stick is in the center, with throttles on the side (where the stick would be in a Cirrus or Columbia). AC, full Garmin integration, and the cool factor of the nose gear retracting, but not having a gear handle. Higher useful load than a Cirrus or Columbia, it would be a great alternative (and cheaper) to one of it’s certified competitors.
Avionics
There is a lot of new avionics technology hitting the market. Dynon, beloved by experimental enthusiasts, is finding a foothold in the certified world with some neat panels. It will be an uphill battle to take on Garmin, but there is some potential in the retrofit market to offer a cheaper alternative to the Garmin TXi.
Speaking of the TXi, I played around with the 10.7″ panel at the Garmin booth. It is extremely intuitive. Garmin did a great job of making it a simple touch screen interface, easy to use, and easy to learn.
Avidyne is pushing their iPad integration with the IFD 100 iPad app. It ties via Wifi or Bluetooth to an IFD 550 or 440 navigator, giving an additional screen in the cockpit to work with. You have the ability to modify flight plans and such on the iPad and it will show up on the GPS units.
Photo Courtesy of William Day, copyright 2018, All Rights Reserved
All in all, Osh Kosh was an experience I’m glad to have finally experienced. I don’t think I would go every year like some folks, but every few years, especially when my sons are older, seems like just enough for me, but not too much.
All Photos Courtesy of William Day, copyright 2018, All Rights Reserved
I got the privilege of going to the EAA AirVenture at Osh Kosh this year. It was my first Osh Kosh experience. I’ll be the first to tell you, walking in the gate on the first day is mildly overwhelming. There are people and stuff everywhere. Airplanes, tents selling everything from airplane parts to mattresses…
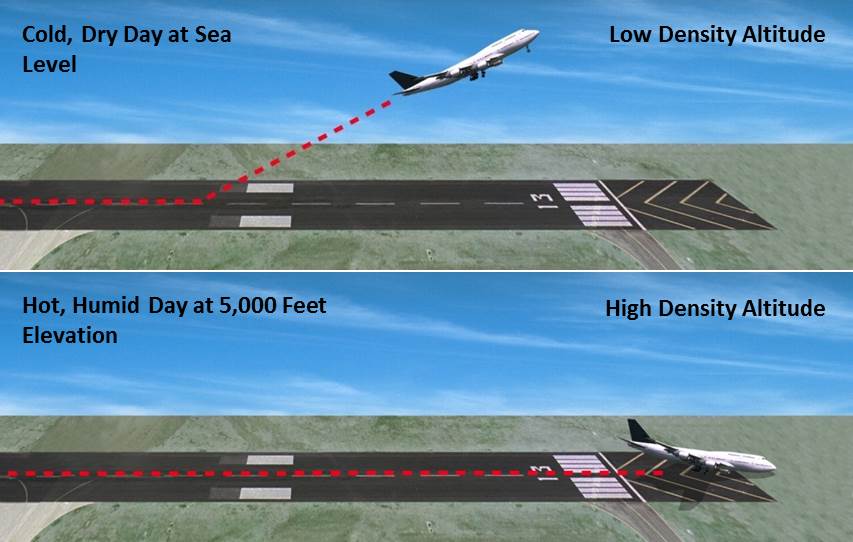
Density Altitude: Pressure Altitude corrected for non-standard temperature.
That’s the book definition of density altitude. The problem is, that definition leaves a lot of general aviation pilots scratching their heads. What really is density altitude?
All airplane engines rely on air and fuel mixing together, then that mixture is ignited to create combustion. Normally aspirated piston engine airplanes get their best performance at sea level, where the air is nice and thick, allowing plenty of air molecules to get sucked in the engine intake. As a normally-aspirated airplane climbs, the ambient air pressure drops with an increase in altitude (the air gets thinner, less dense), thereby reducing airplane takeoff, climb, and landing performance. There just isn’t as much air at higher altitudes, to put it simply.
Turbo charged piston engines assist with this air density problem. A turbo charger boosts the air coming into the engine and fools the engine into thinking it is at sea level pressure all the time. The higher the altitude, the faster the turbo charger spins, spinning the compressor faster, which compresses more air to continue to give the engine sea level pressure air. This gets faster cruise speeds the higher you go.
Both normally aspirated & turbo charged engines do experience longer takeoff rolls and reduced climb rates at higher airport elevations & higher altitudes.
How does this all relate to density altitude?
When the outside air temperature rises, the air becomes thinner, less dense. This means that when an airport elevation is 1,000 feet, but the density altitude is reported as 3,000 feet, the airplane engine thinks it is at 3,000 feet. It won’t accelerate as fast. The airplane’s climb rate will also be reduced. That means that the normal climb pitch attitude a pilot is used to seeing won’t be accurate at higher density altitudes. It will lead to slower indicated airspeeds, slow enough to potentially lead to a stall if a pilot isn’t paying attention.
Where does this get dangerous? High elevation airports. Whenever the OAT creeps above 85 or 90 at an airport that is higher elevation (I would classify higher elevation as 2,500 feet or higher), the corresponding density altitude sky rockets. If a pilot isn’t paying attention to airspeed or angle of attack (if the airplane is equipped with an AOA), a stall can come very quickly on climb out.
What to take home from this? Monitor your climb speed and angle of attack, especially right after takeoff, when you hear density altitude on the ATIS or AWOS.
Density Altitude: Pressure Altitude corrected for non-standard temperature. That’s the book definition of density altitude. The problem is, that definition leaves a lot of general aviation pilots scratching their heads. What really is density altitude? All airplane engines rely on air and fuel mixing together, then that mixture is ignited to create combustion. Normally aspirated…
Brazilian manufacturer Embraer recently received FAA certification for it’s “mid-light” Legacy 450. Capable of Mach .83 and a 2,500 mile range, this is one sweet airplane. Embraer designers gave passengers headroom as the cabin stretches up to 6 feet in height down the center. Complete with fly by wire controls and a full glass cockpit configuration, Embraer did a wonderful job with this airplane. The club seats even fold down to a bed!
The airplane’s list price is $16.5 million. To learn more about the Legacy 450, visit Embraer’s website.
Brazilian manufacturer Embraer recently received FAA certification for it’s “mid-light” Legacy 450. Capable of Mach .83 and a 2,500 mile range, this is one sweet airplane. Embraer designers gave passengers headroom as the cabin stretches up to 6 feet in height down the center. Complete with fly by wire controls and a full glass cockpit…
The Piper PA-46 series, which includes models like the piston engine Piper Malibu and Piper Mirage, and the turboprops Piper Meridian, M500, and M600, is a popular choice for private pilots and business aviation. Known for its impressive speed, range, and pressurization, the PA-46 is a very capable single pilot aircraft. However, like all high-performance aircraft, it presents its own set of challenges and risks, especially when pilot error or adverse conditions come into play.
The 2024 PMOPA (Piper M-Class Owner’s and Pilot’s Association) Convention was the first weekend in November and one of the sessions every year is the PA-46 Safety Review. Sadly, in 2024, the accidents involving various PA-46 models pointed out several areas related to decision making that all pilots need to put be aware of. These accidents highlight critical issues in weather awareness, pilot training, and decision-making, and they provide valuable lessons for other pilots in any type of aircraft.
Overview of the 2024 Piper PA-46 Accidents
The Piper PA-46 is generally regarded as a reliable and capable aircraft, but the safe outcome of a flight often times depends on the pilot’s decision making. There always can be mechanical malfunctions, but those still require good pilot decision making to be able to walk away from the accident.
In 2024, multiple accidents occurred involving different variants of the PA-46, with many of the accidents occurring during critical phases of flight like takeoff or landing. Some of the key factors contributing to these accidents included:
Weather Challenges: In several cases, adverse weather conditions, such as low visibility, thunderstorms, or high winds, contributed to accidents. Despite most PA-46’s being equipped with NexRad and weather radar, pilots sometimes underestimated or misjudged the weather risks.
Pilot Decision-Making: A recurring theme in these accidents was pilot error—specifically, poor decision-making when faced with challenging conditions. In some cases, pilots continued flights despite deteriorating weather or failed to react appropriately to emergency situations.
Mechanical Failures: As with every airplane, systems fail on a Piper PA-46. Several accidents were due to engine power loss. Proper training teaches pilots how to have the right mindset and skills to handle those engine power loss situations, taking a bad situation and having the best possible outcome due to good decision making and gliding skills.
Three Key Lessons for Pilots
The Piper PA-46 accidents of 2024 serve as valuable reminders about the importance of pilot preparation, decision-making, and risk management. Here are three critical lessons pilots can take away from these accidents:
1. Prioritize Pre-Flight Weather Planning
Poor weather conditions were a significant factor in some of the crashes in 2024. Pilots of high-performance aircraft must place a strong emphasis on weather pre-flight planning, especially when flying into regions prone to rapidly changing weather or severe conditions and across frontal systems. Pilots should:
Stay up-to-date with weather briefings before and during the flight, including calls to Flight Service Station if there is serious weather along the route.
Be proactive in altering flight plans or delaying departures when weather conditions become unfavorable.
Utilize onboard weather radar and other tools to monitor changing conditions in real time and avoid nasty looking weather systems. ADS-B and XM Weather are delayed information. They are not meant to be used to find holes through storm systems.
Finally, don’t try to shoot through holes! They are called sucker holes for a reason.
2. Master Emergency Procedures
Pilots of all aircraft, not just PA-46 models, need to practice engine-out procedures multiple times a year with an instructor, not just at recurrent training. The goal is to make emergency procedures second nature which creates the right mindset to handle the emergency, creating a much better outcome. Training should focus on:
Engine-out procedures immediately after takeoff, climbing out at low altitude, and at cruise.
Performance with the propeller feathered and unfeathered, recognizing how the feathered prop increases glide range.
Practicing forced landings and other emergency scenarios regularly to build confidence and competence.
3. Always Plan for an Emergency Landing
It is very important to know your options in the event of an emergency. When flying over mountainous or remote areas, pilots should always have a contingency plan for where to land if something goes wrong. An emergency engine out brief should be a part of every pre-takeoff briefing to put the pilot in the right mindset. Pilots should:
Brief an engine failure on the runway, low altitude, and at an altitude that allows for a safe return to the airport in the event of an engine failure as part of every pre-takeoff briefing.
Study the flight route in detail and identify suitable emergency landing sites along the way, especially when flying in areas with limited options.
Consider the terrain, weather conditions, and available options in the event of an engine failure or other emergency.
Use terrain awareness and other onboard tools to help identify suitable landing areas in real-time, including the ForeFlight Glide Advisor.
Conclusion
The Piper PA-46 series, while a capable and reliable aircraft, demands a high level of skill and preparation from its pilots. The accidents in 2024 serve as a sobering reminder of the critical importance of weather awareness, emergency training, and proper flight planning. By learning from these accidents, pilots can make better decisions, have the right mindset, and reduce the risk of similar accidents in the future.
By prioritizing weather awareness, mastering emergency procedures, and always having a contingency plan for forced landings, pilots of the Piper PA-46 can improve their ability to handle the challenges posed by these high-performance aircraft. These lessons are not just for PA-46 pilots, but for all pilots striving to fly safely and confidently.
The Piper PA-46 series, which includes models like the piston engine Piper Malibu and Piper Mirage, and the turboprops Piper Meridian, M500, and M600, is a popular choice for private pilots and business aviation. Known for its impressive speed, range, and pressurization, the PA-46 is a very capable single pilot aircraft. However, like all high-performance…